
Fig. 1.
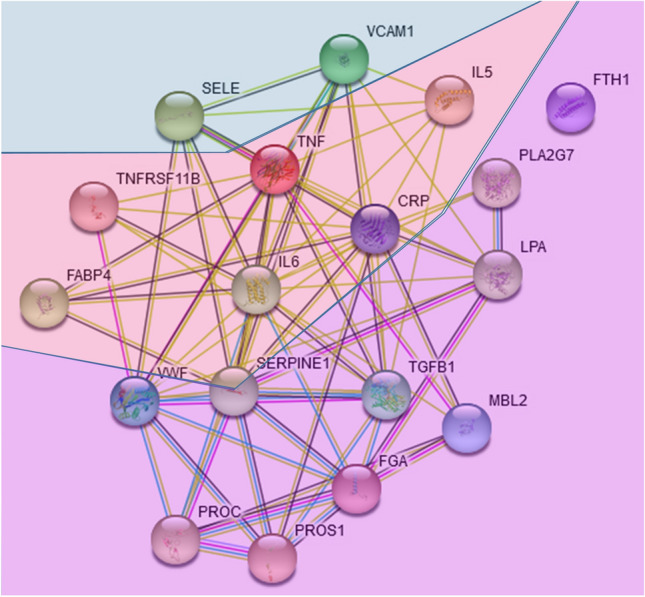
STRING network of the proteins in Table 1. The three adhesion-related biomarkers are positioned at the top; the coagulation-related biomarkers are positioned at the bottom. The immune-inflammation biomarkers are found in the middle of the network (pale red), using the default parameters of the STRING web interface; the layout considers node connectivity. As explained in detail in the online legend associated with the network, there is no particular meaning of the node color. The edge color refers to the source database of the interaction, i.e., curated databases (cyan), experimentally determined (magenta), predicted by gene neighborhood (green), by gene fusions (red) or by gene co-occurrence (blue), or taken from text mining (light green), co-expression (black) or protein homology (light blue) data. The permanent link to the network, including an online legend, is https://version-11-0b.string-db.org/cgi/network?taskId=b4MNWvbtbPcL