
Figure 3. Ptbp1 downregulation by shRNA-based depletion fails to convert MG into RGCs in Sun1-GFP fate-mapping (Glast-CreERT;Rosa-CAG-LSL-Sun1-GFP) mice.
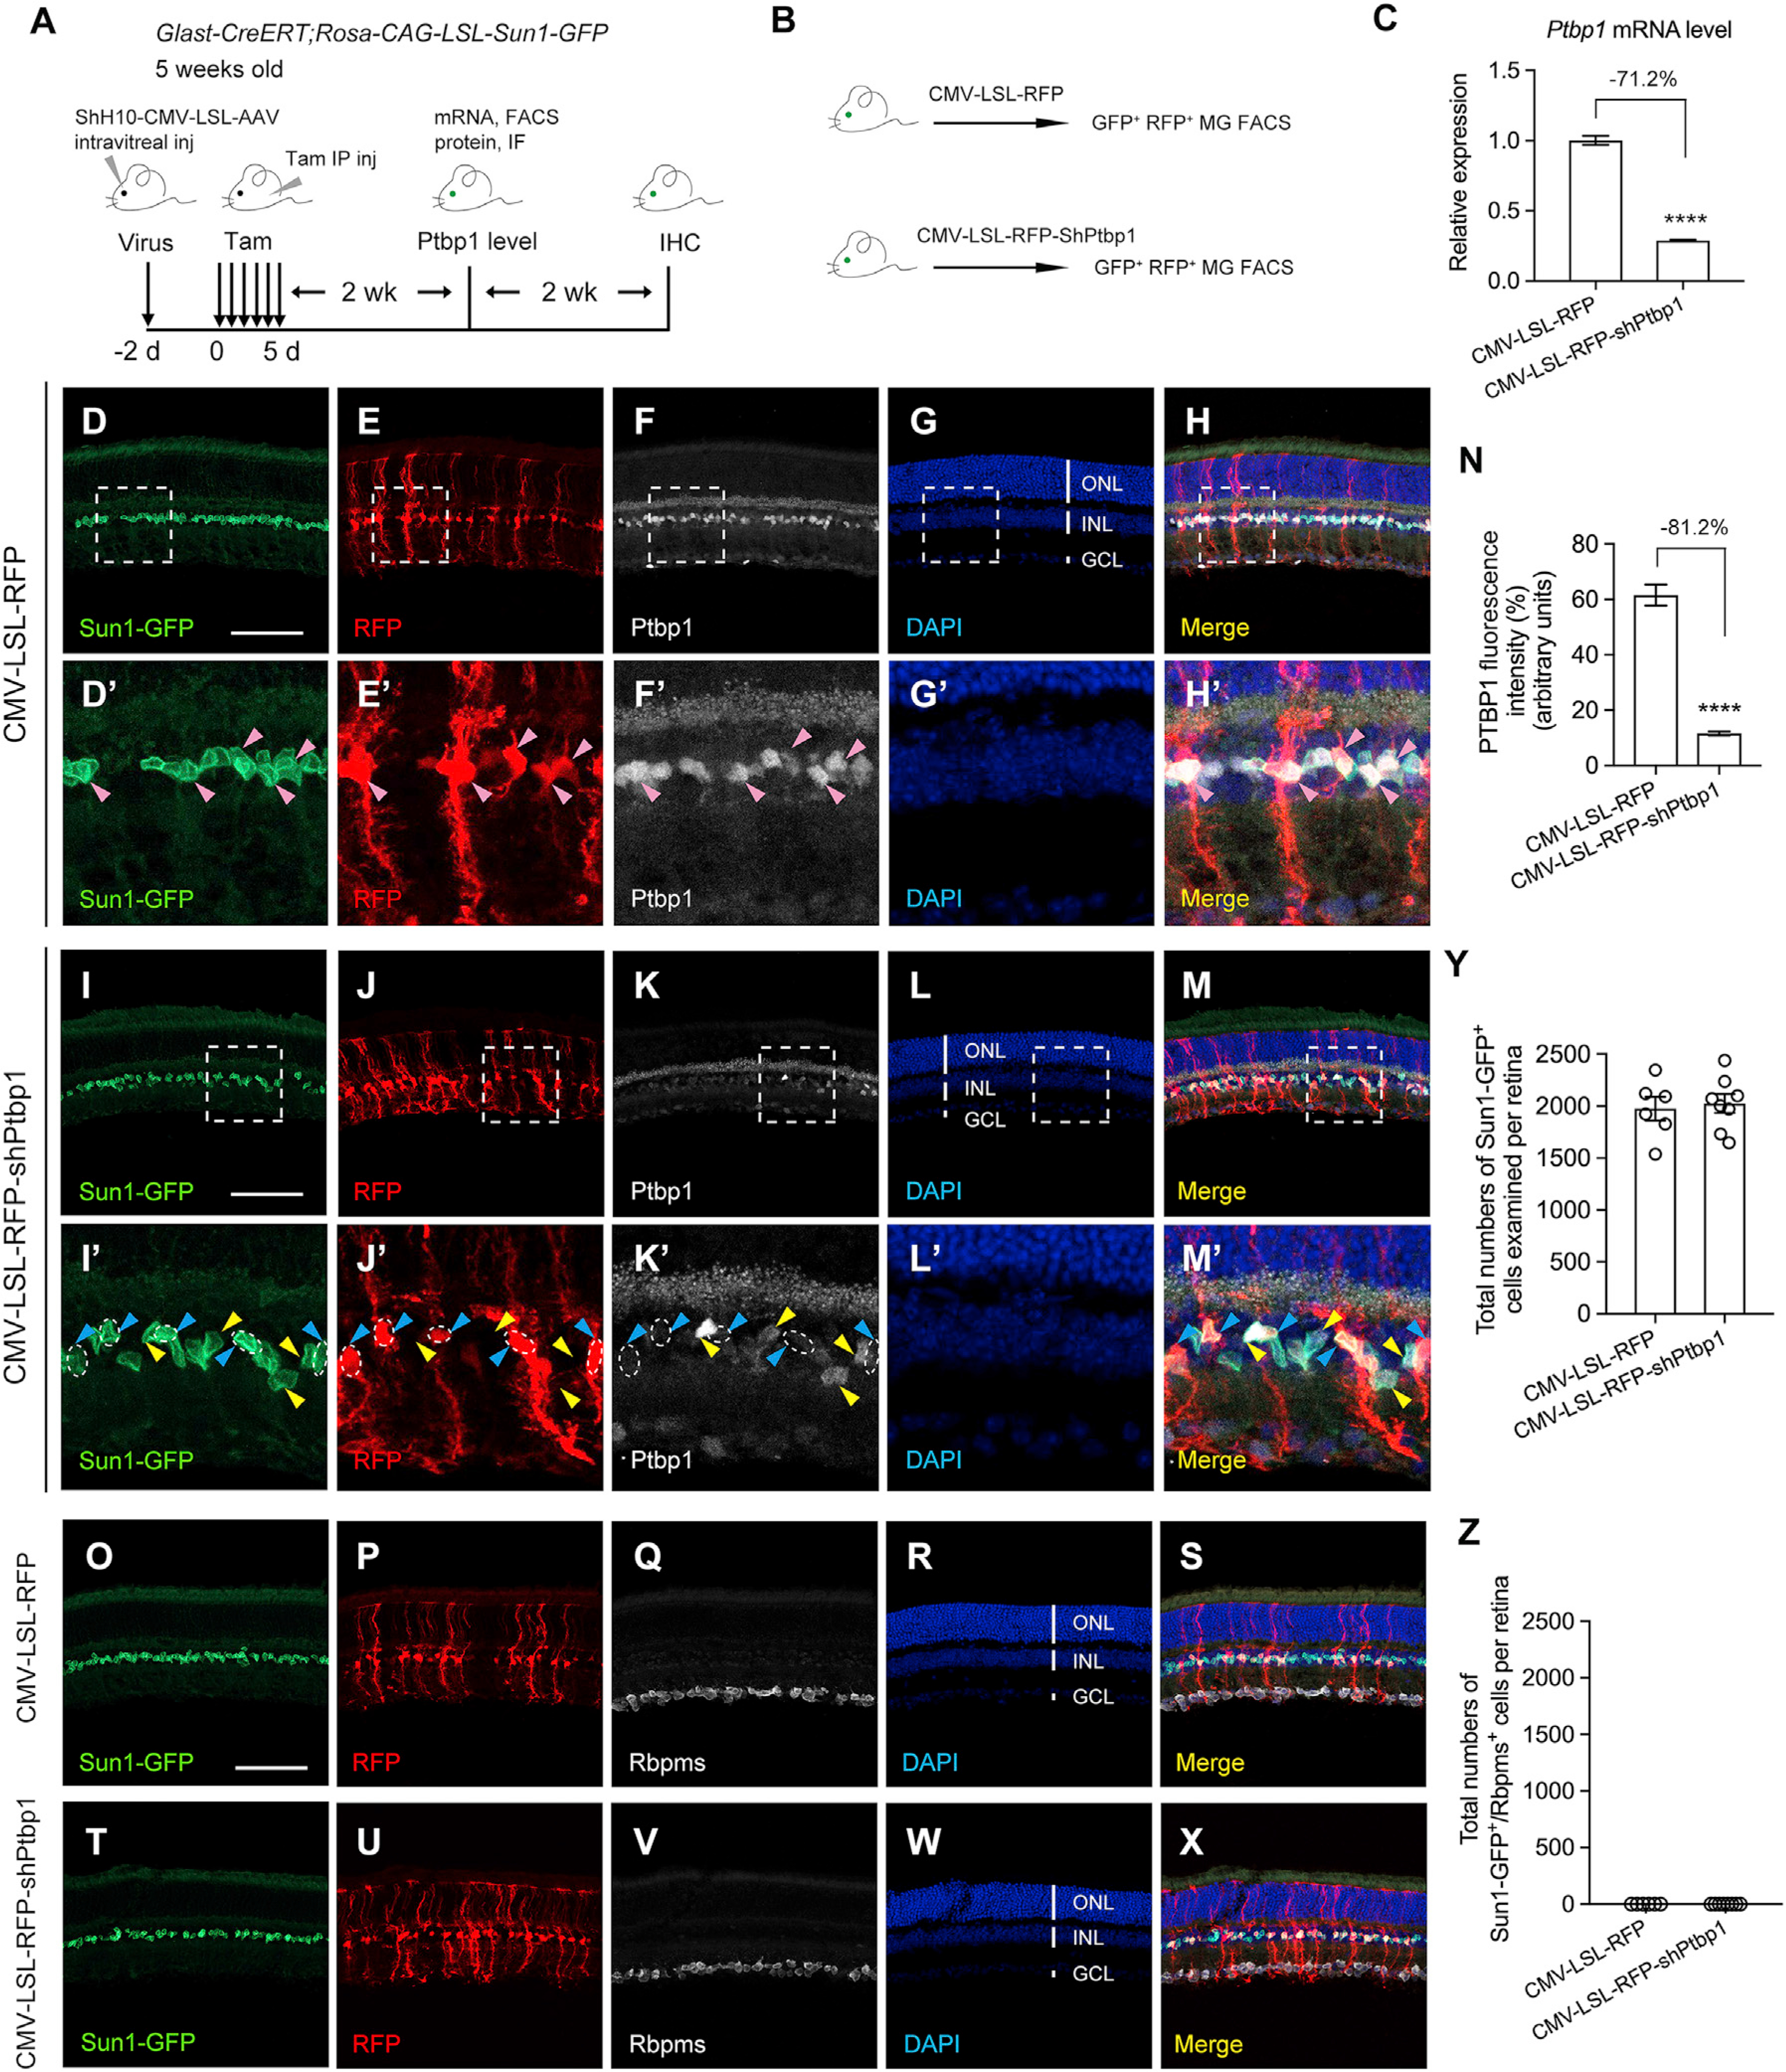
(A) Experimental design for testing MG-to-RGC conversion in Sun1-GFP fate-mapping mice. Intravitreal injection of ShH10-CMV-LSL-AAVs was performed inSun1-GFP fate-mapping mice at 5 weeks of age, followed by tamoxifen administration 2 days later to induce Sun1-GFP expression in MG and Ptbp1 depletion. Fluorescence-activated cell sorting (FACS) and immunofluorescence (IF) were used, respectively, to measure Ptbp1 mRNA and protein levels at 2 weeks after tamoxifen injection. Immunohistochemistry analysis was performed using the pan-RGC marker RBPMS at 4 weeks after tamoxifen injection. IHC, immunohistochemistry.
(B) Experimental design for FACS purification of Sun1-GFP-labeled MG receiving ShH10-CMV-LSL-RFP (control) or CMV-LSL-RFP-shPtbp1 (Ptbp1 depletion).
(C) Real-time qPCR analysis in AAV-transduced (RFP+) Sun1-GFP-labeled MG showing high-efficiency knockdown of Ptbp1. The relative expression level of Ptbp1 in AAV-CMV-LSL-RFP (control) transduced MG was set as 1. Data are presented as the mean ± SEM, n = 3, ****p < 0.0001, unpaired t test.
(D–H) Confocal images showing Ptbp1 expression in Sun1-GFP fate-mapping mice receiving intravitreal injection of ShH10-CMV-LSL-RFP (control). Scale bar, 100 μm. The boxed areas are enlarged in (D′–H′). Pink arrowheads indicate that Ptbp1 levels were maintained in RFP+ Sun1-GFP-labeled MG.
(I–M) Confocal images showing Ptbp1 expression in Sun1-GFP fate-mapping mice receiving intravitreal injection of ShH10-CMV-LSL-RFP-shPtbp1 (Ptbp1 depletion). Scale bar, 100 μm. The boxed areas are enlarged in (I′–M′). Blue arrowheads indicate that Ptbp1 levels were depleted in RFP+ Sun1-GFP-labeled MG. Yellow arrow-heads indicate that Ptbp1 levels were maintained in RFP− Sun1-GFP-labeled MG (non-transduced MG, serving as an internal control for Ptbp1 depletion in transduced MG).
(N) Quantification of PTBP1 immunofluorescence intensity in AAV-transduced (RFP+) Sun1-GFP-labeled MG showing high-efficiency knockdown of Ptbp1. n = 4–5 retinas per group. Data are presented as the mean ± SEM, ****p < 0.0001, unpaired t test.
(O–S) Confocal images showing expression of Sun1-GFP and RBPMS immunohistochemistry in retinas receiving CMV-LSL-RFP.
(T–X) Confocal images showing expression of Sun1-GFP and RBPMS immunohistochemistry in retinas receiving CMV-LSL-RFP-shPtbp1.
(O–X) Scale bar, 100 μm. ONL, outer nuclear layer; INL, inner nuclear layer; GCL, ganglion cell layer.
(Y) Total numbers of Sun1-GFP-labeled MG examined in retinas (4 weeks after tamoxifen injection) receiving CMV-LSL-RFP (control) or CMV-LSL-RFP-shPtbp1 (Ptbp1 depletion). Data are presented as mean ± SEM, n = 6–8 retinas per group.
(Z) Total numbers of Sun1-GFP-labeled MG that were also immunoreactive for the pan-RGC marker RBPMS per retina after Pbtp1 depletion. See also Figures S2 and S3.