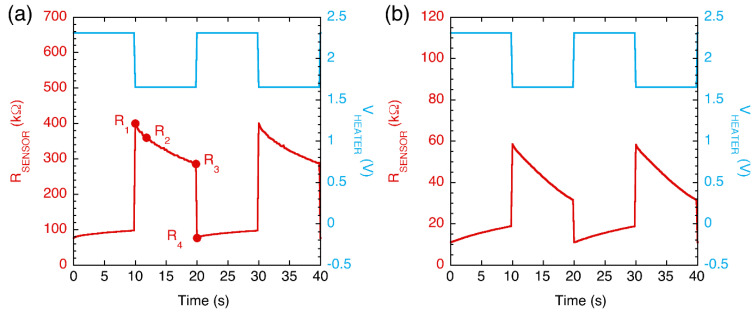
Figure 2.
Sensor resistance vs. time curves acquired during sensor exposure to air (a) and to the headspace of a fish sample at the storage time of 14 h (b). In both cases, experiments were carried out inside the refrigerator (4 °C). The modulation of the heater voltage is also shown. Full circles in (a) indicate the resistance values used to extrapolate parameters (features) that resume the shape of the curve (see text for details).

