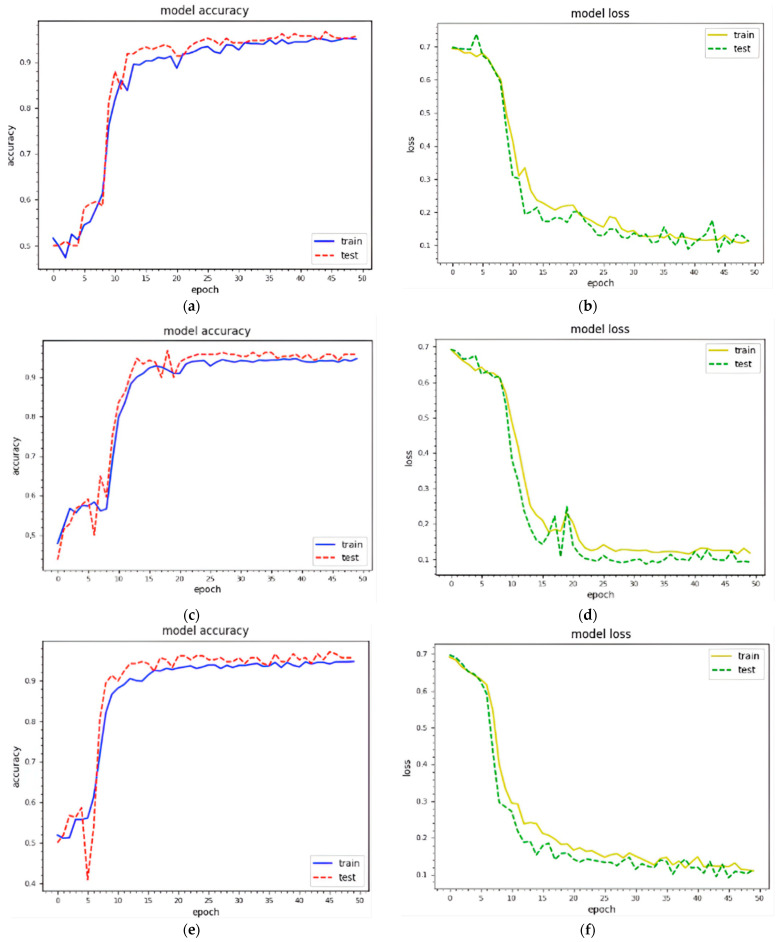
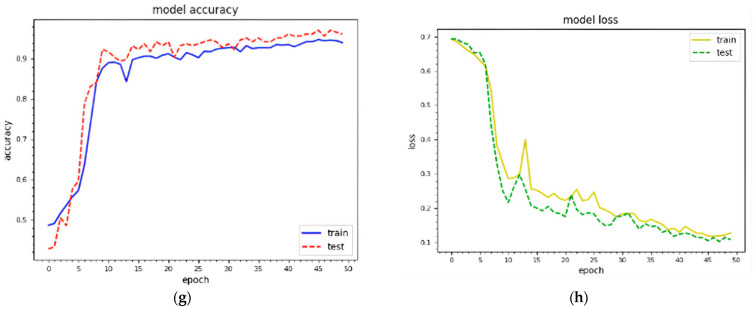
Figure 5.
Epoch curves for training and testing data points using different visual representations for dataset 1, i.e., 229 × 229, 256 × 256 (training accuracy, training loss; testing accuracy, testing loss). (a) 229 × 229 (classification); (b) 229 × 229 (classification); (c) 229 × 229 (detection); (d) 229 × 229 (detection); (e) 256 × 256 (classification); (f) 256 × 56 (classification); (g) 256 × 256 (detection); (h) 256 × 256 (detection).


