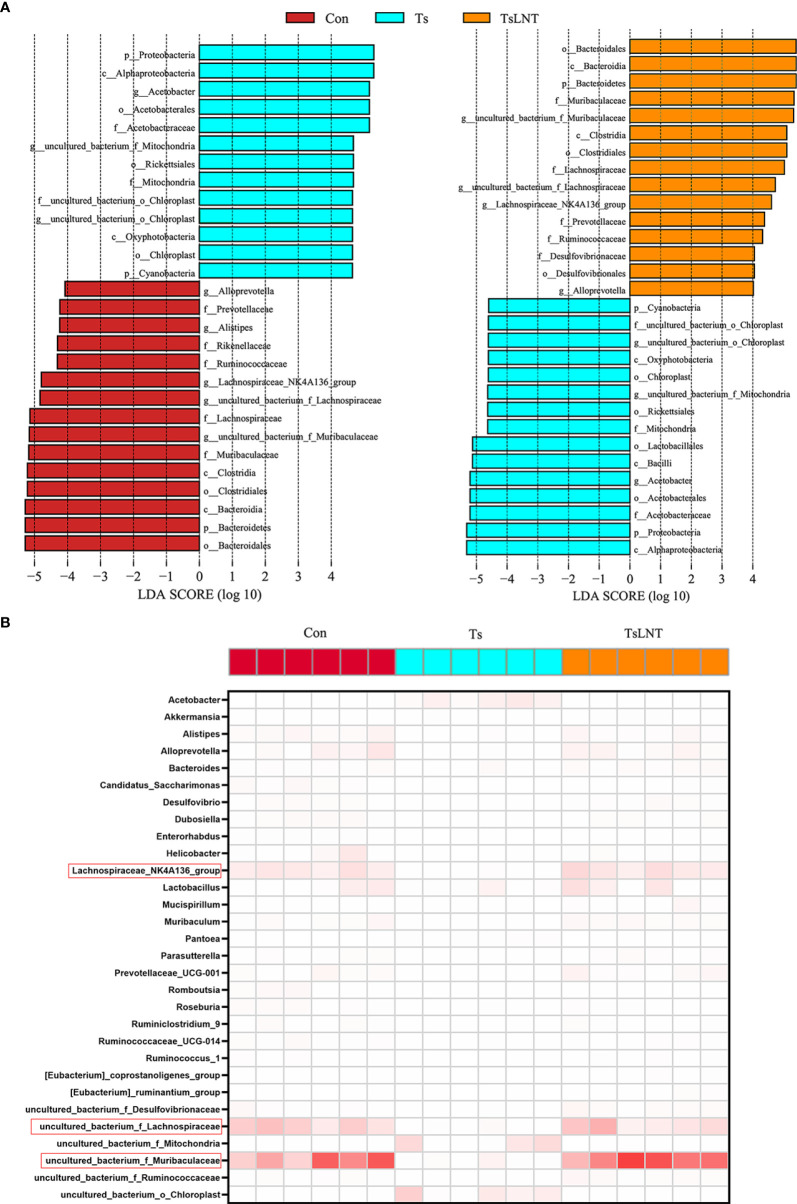
Figure 3.
The most differentially significant abundant taxa enriched in microbiota by linear discriminant analysis (LDA). (A) Linear discriminant analysis (LDA) effect size showing the most differentially significant abundant taxa enriched in microbiota from the control group (Con), T. spiralis group (Ts), and T. spiralis + LNT group (TsLNT). (B) Heatmap of the abundance of bacteria at the genus level from the Con, Ts and TsLNT groups.

