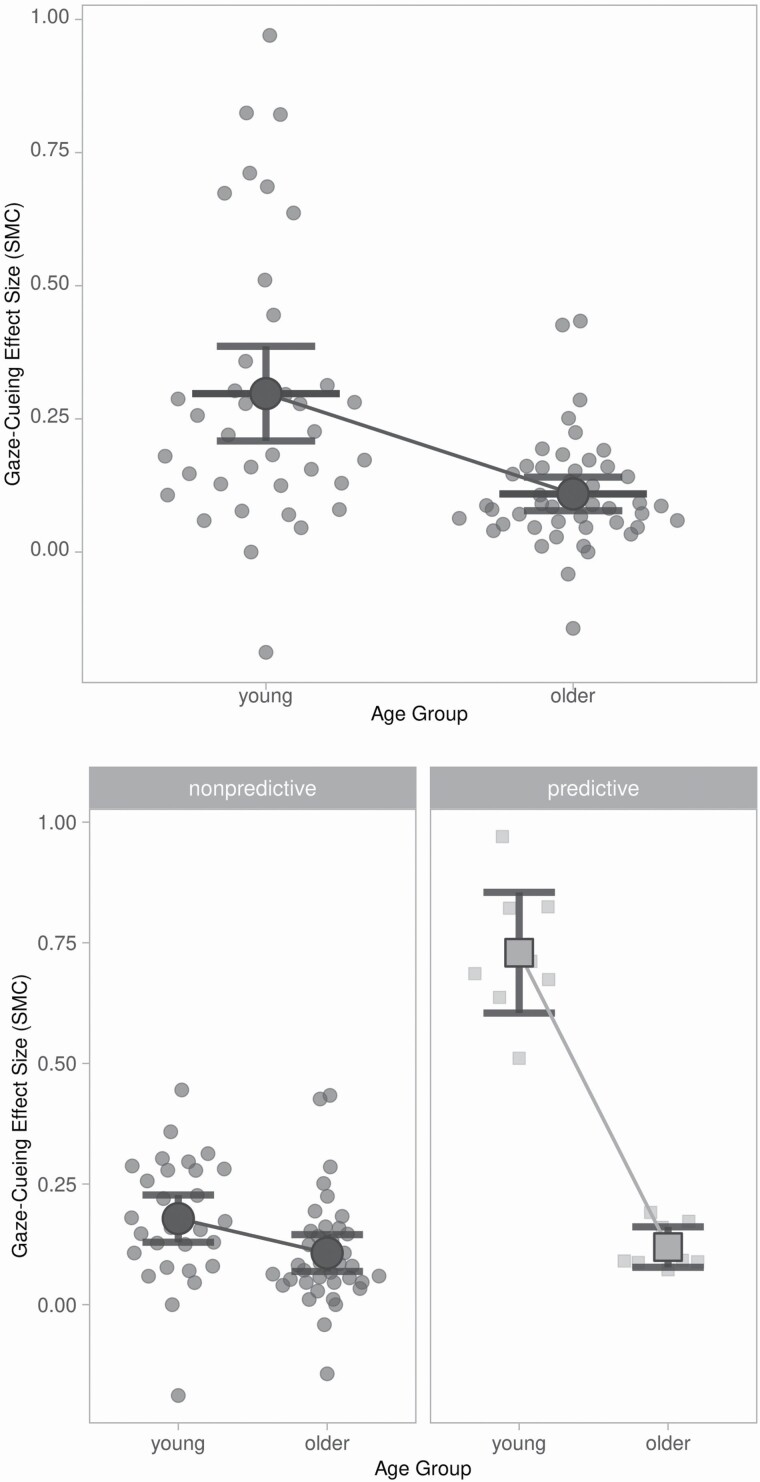
Figure 3.
Gaze-cueing effects by age group overall (top) and for predictive (bottom left) and nonpredictive (bottom right) cues separately. Note: The mean effect size for each age group is represented by the larger superordinate shapes that each have an associated pair of error bars. Error bars represent the 95% confidence interval around the mean effect size for each age group. Figure created using SuperPlotsOfData (Goedhart, 2021).

