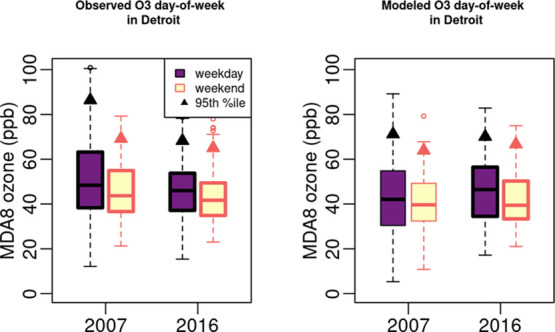
Figure 10.

May–September weekday versus weekend MDA8 O3 in the Detroit nonattainment area for 2007 and 2016 based on monitored values (left panel) and modeled values in grid cells containing monitor locations (left panel). Boxes represent the 25th–75th percentile, horizontal lines represent median values, whiskers extend to 1.5× the interquartile range, dots show outlier values, and triangles represent 95th percentile values. A bold outline around a box indicates a significant difference (p < 0.05).
