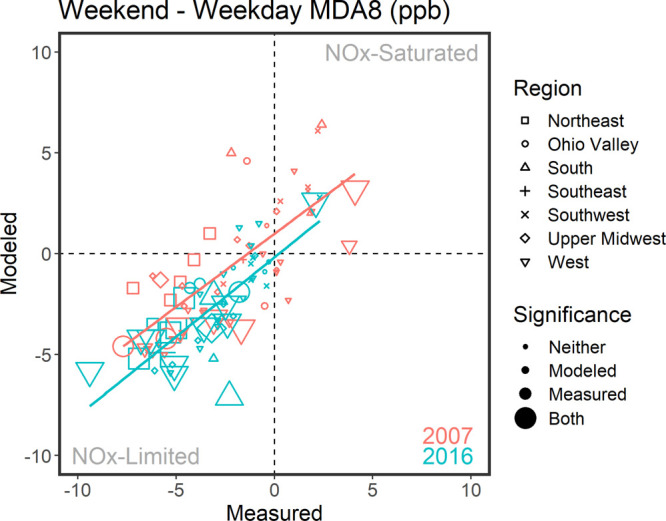
Figure 3.

Measured vs modeled WE–WD differences in nonattainment areas by region in 2007 and 2016. The size of the shape corresponds to whether neither, one, or both values were highly significant (i.e., p-value less than 0.01). See Table S2 for specific areas and WE–WD values.
