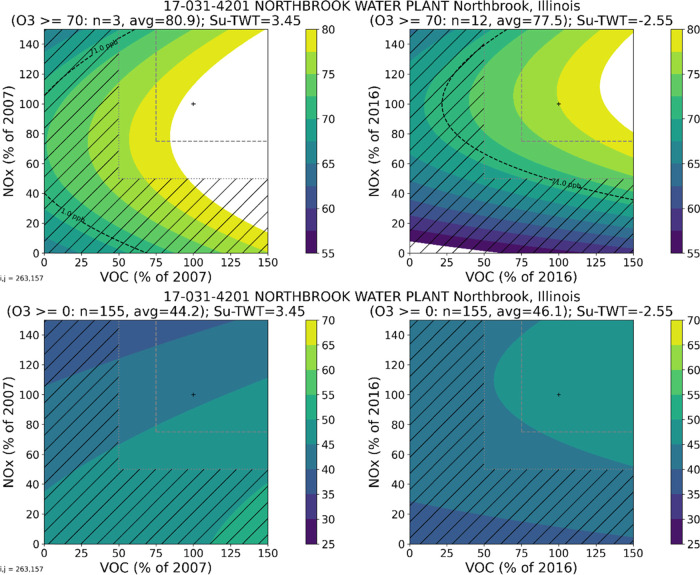
Figure 8.
O3 isopleths in 2007 (left) and 2016 (right) for all MDA8 (O3 > 0) (bottom panels) and high MDA8 (O3 > 70 ppb) (top panels) for the Northbrook, IL, monitor in the Chicago nonattainment area. Color bars indicate the corresponding O3 isopleth value. Dashed boxes are shown at 50 and 75% of original emissions, and hatching covers the area where large emission reductions (from 50–100%) are outside the domain of the expected HDDM accuracy. The curved dotted line depicts locations in the O3 isopleth space that match 71 ppb MDA8 O3, below which the site would not be modeling exceedances of the 2015 O3 NAAQS.

