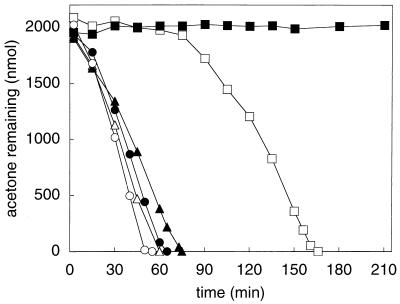
FIG. 1.
Effect of growth substrate on acetone metabolism by R. rhodochrous B276. Closed symbols, assays that contained rifampin and chloramphenicol; open symbols, assays without rifampin and chloramphenicol; squares, glucose-grown cells (0.48 mg of protein); circles, isopropanol-grown cells (0.38 mg of protein); triangles, acetone-grown cells (0.40 mg of protein). Each data point represents the average of duplicate assays.

