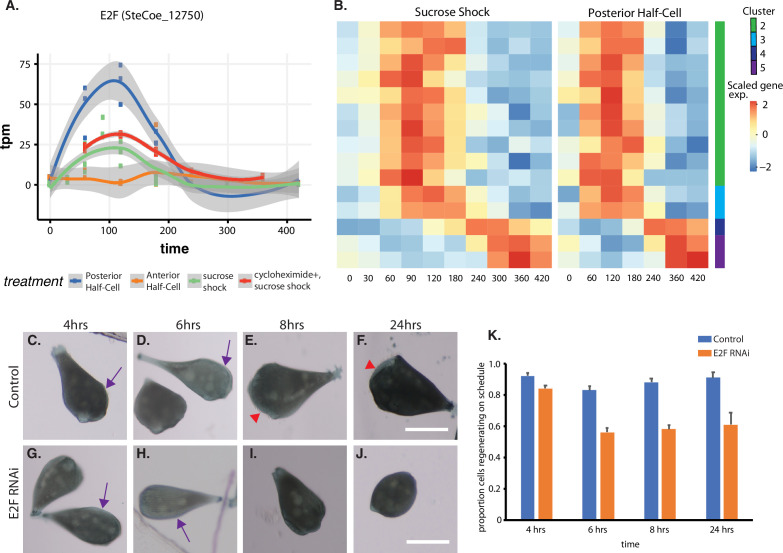
Figure 5. Expression of E2F and its targets during oral apparatus (OA) regeneration.
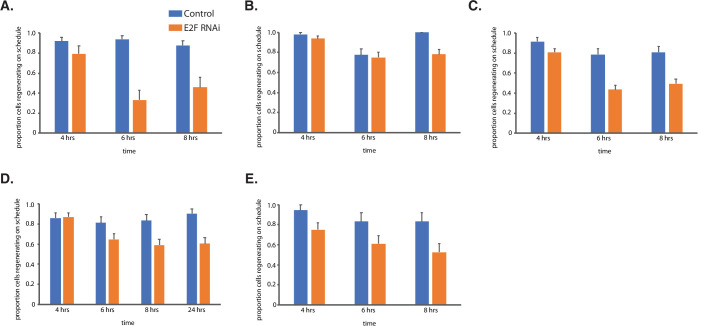
(A) E2F is an early-expressed gene. Plot shows expression of E2F homolog SteCoe_12750 as a function of time including in cycloheximide-treated cells. OA (blue curve) indicates expression in sucrose-shocked cells. The purple curve shows that E2F is still upregulated in cells in which protein synthesis is inhibited. (B) Expression heatmap of predicted E2F targets in the OA-specific expression module. Clusters refer to clusters in the original clustering of OA-specific genes (Figure 2A). Cluster 1 is not included in the plot because there were no predicted E2F targets among the cluster 1 genes. (C–F) Examples of control cells at 4, 6, 8, and 24 hr after regeneration. Purple arrows mark the location of oral primordium. Red arrow head marks the location of a fully formed OA. (G–J) Examples of E2F RNAi cells at 4, 6, 8, and 24 hr, illustrating the proper formation of the oral primordium by 4 hr, but lack of visible primordium or OA at later stages. All scale bars 200 μm. (K) Fraction of cells regenerating properly at each time point. For the 4, 6, and 8 hr time points, on-schedule regeneration is defined as cells having a visible oral primordium (4 hr), a full length primordium extended along the side of the cell (6 hr), and an oral apparatus located at the anterior end of the cell whose diameter is at least 50% of the diameter of the cell (8 and 24 hr). Total number of cells analyzed from five separate biological experiments was n=206 for control and 310 for RNAi. Error bars represent standard error for the proportions expected based on a Bernoulli distribution. For all four time points, the proportion of RNAi cells regenerating on schedule (defined according to a set of milestone events as described in Materials and methods) was significantly less than for controls, with p values of (p=0.007, p<0.0001, p<0.0001, and p=0.0005) respectively based on Fisher’s exact test.


