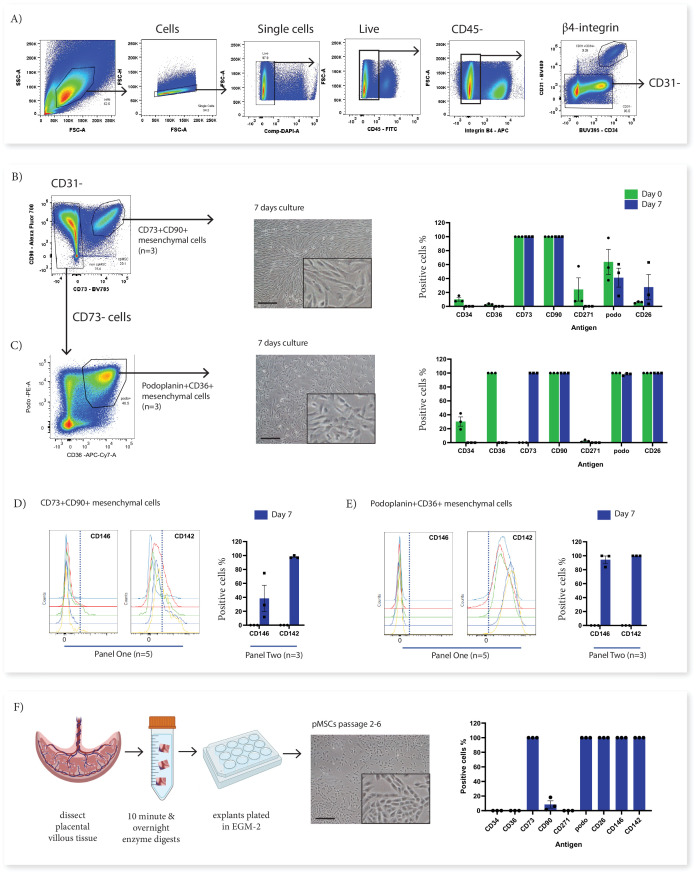
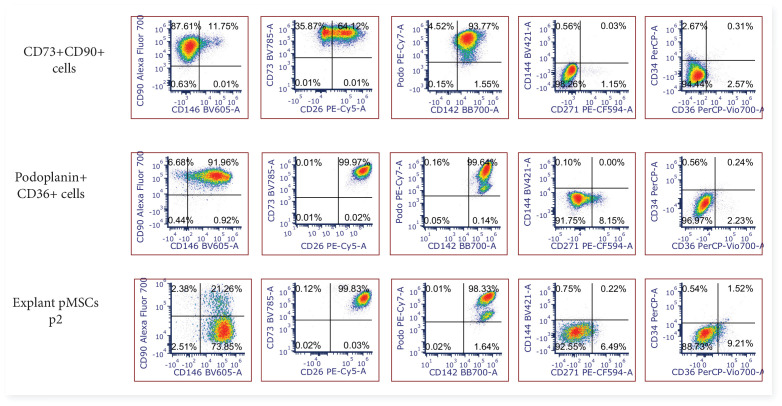
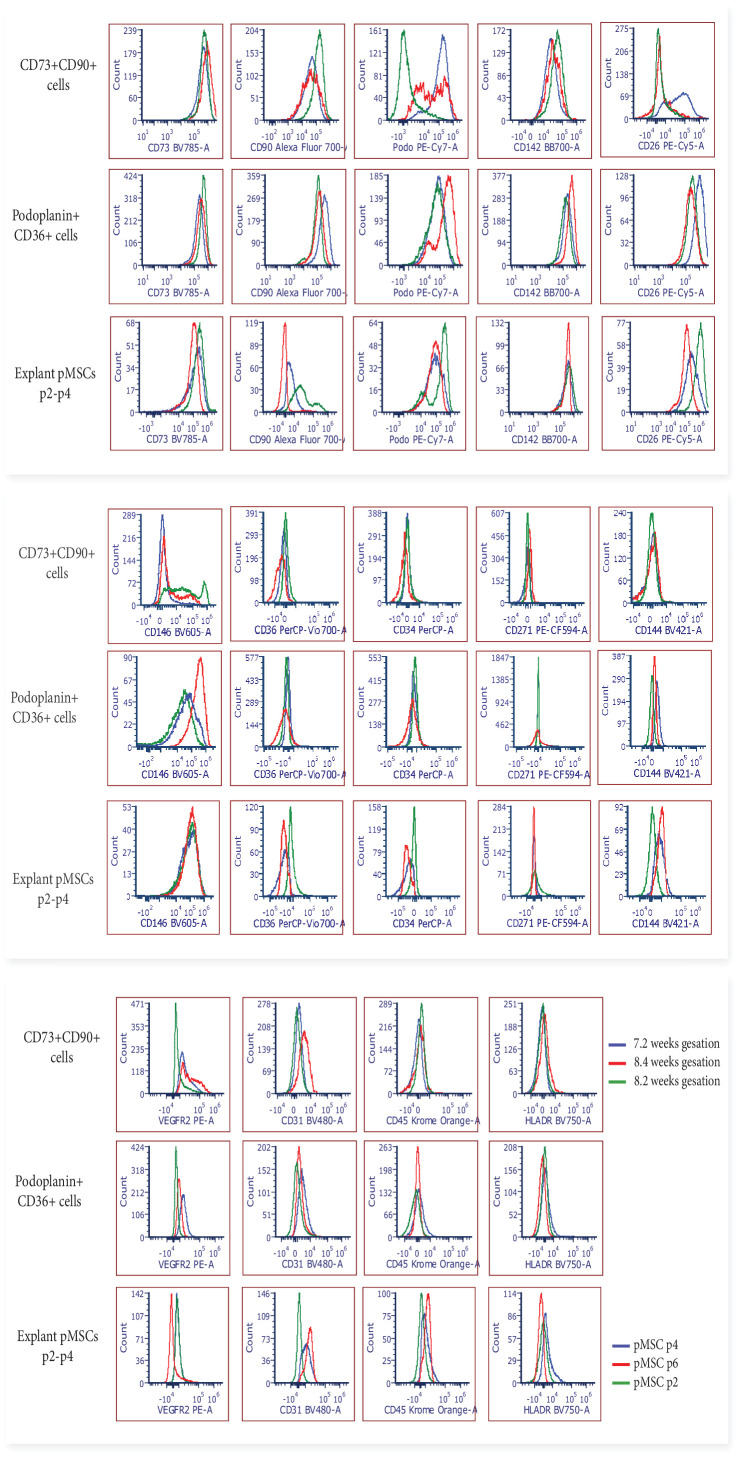
Figure 4. In vitro culture of CD73+CD90+ and podoplanin+CD36+ cells.
(A) FACS sorting was used to isolate CD73+CD90+ and podoplanin+CD36+ cells from placental villous core cells (n=3). (B) Morphology and phenotype of CD73+CD90+ cells after 7 days in culture. (C) Phenotype of podoplanin+CD36+ cells after 7 days in culture. (D) CD146 and CD142 expression on CD73+CD90+ analysed with Panel One (day 0, n=5) or at 7 days after culture (n=3). (E) CD146 and CD142 expression on podoplanin+CD36+ cells analysed with Panel One (day 0, n=5) or at 7 days after culture (n=3). (F) Isolation of explant-derived pMSCs, and morphology and phenotype of passaged pMSCs (n=3). Error bars = standard error of the mean and scale bar = 100 µm.


