. 2022 Aug 2;11:e80725. doi: 10.7554/eLife.80725

Figure 2. Glutamine deprivation causes metabolic reprogramming to inhibit glycolysis.

(A–C) Primary murine chondrocytes were cultured in media containing 4 mM glutamine or 0 mM glutamine for 24 hr. Cells were then treated with IL-1β (10 ng/mL) for 24 hr. Gene expression of G6pd2, Eno1, and Ldha was measured by quantitative PCR from n=6 replicates. One-way ANOVA was performed followed by Tukey’s multiple comparisons test. A: *p=0.0242, ****p<0.0001, B: ****p<0.0001, and C: ****p<0.0001. (D–K) Under similar conditions, metabolite levels were measured by Liquid chromatography–mass spectrometry (LC-MS) with n=3 replicates. One-way ANOVA was performed followed by Tukey’s multiple comparisons test. D: ***p=0.0003, E:***p=0.0006, F: p>0.05, G: p>0.05, H:*p=0.036, I: **p=0.0012, J:**p=0.0079, and K: **p=0.009.

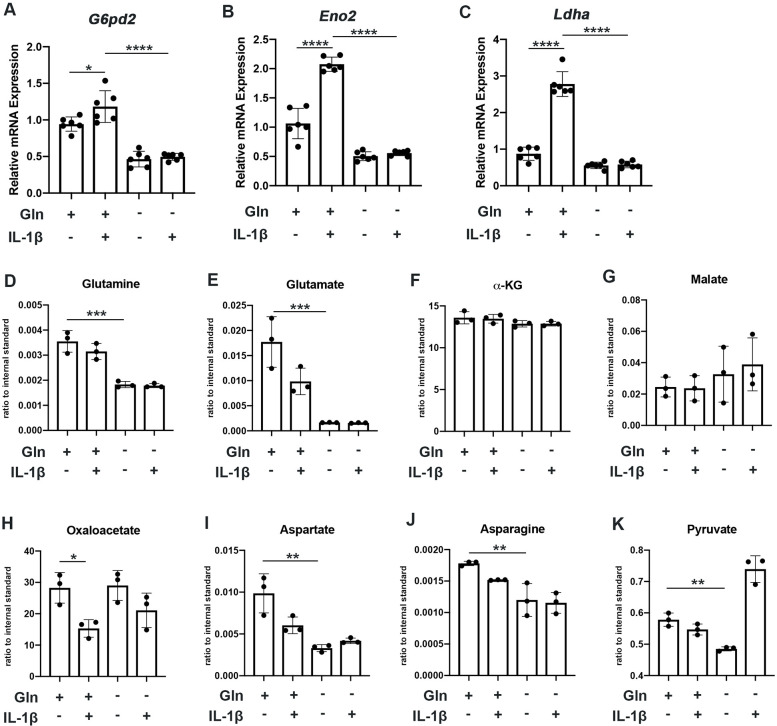
Figure 2—source data 1. Depicting original raw data related to Figure 2.

Figure 2.

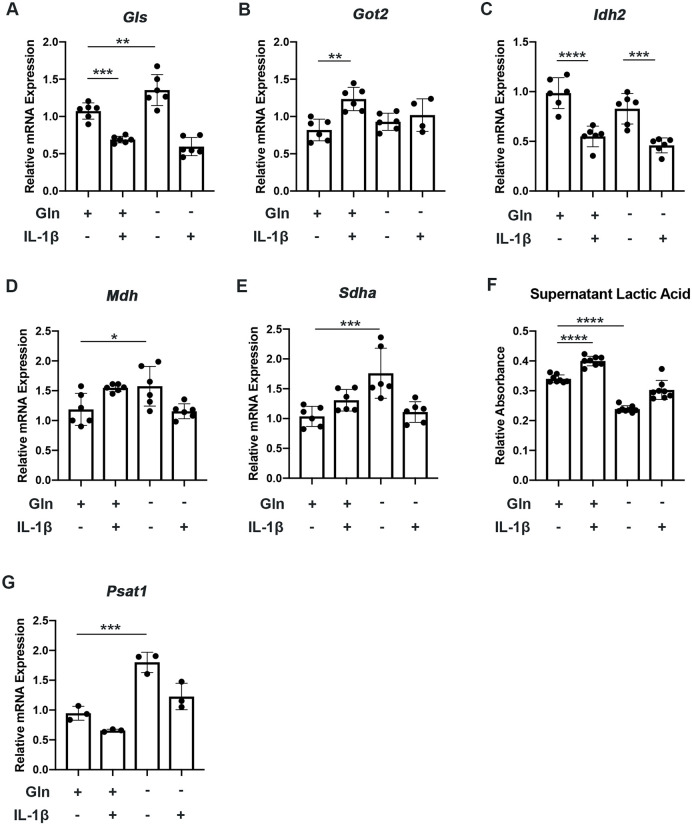
Figure 2—figure supplement 1. Glutamine deprivation causes metabolic reprogramming to inhibit glycolysis.

Figure 2—figure supplement 1.

(A–E) Primary murine chondrocytes were cultured in media containing 4 mM glutamine or 0 mM glutamine for 24 hr. Cells were then treated with IL-1β (10 ng/mL) for 24 hr. Gene expression of Gls, Got2, Idh2, Mdh, and Sdha was measured by quantitative PCR (qPCR) from n=6 replicates. One-way ANOVA was performed followed by Tukey’s multiple comparisons test. A: **p=0.0085 and ***p<0.0004; B: **p=0.0011; C: ****p<0.0001 and ***p=0.0003; D:*p=0.036; E:***p=0.0005. (F) Under similar conditions, supernatant was collected, and lactic acid was measured. One-way ANOVA was performed followed by Tukey’s multiple comparisons test. ****p<0.0001. (G) Gene expression of Psat1 was measured under similar conditions by qPCR. One-way ANOVA was performed followed by Tukey’s multiple comparisons test. ***p=0.0006.
Figure 2—figure supplement 1—source data 1. Depicting original raw data related to Figure 2—figure supplement 1.