. 2022 Aug 2;11:e80725. doi: 10.7554/eLife.80725

Figure 3. Glutamine deprivation inhibits the inflammatory response.

(A–B) Primary murine chondrocytes were cultured in media containing 4 mM glutamine or 0 mM glutamine for 24 hr. Cells were then treated with IL-1β (10 ng/mL) for 24 hr. Gene expression of Il6 and Mmp13 was measured by quantitative PCR (qPCR). One-way ANOVA was performed followed by Tukey’s multiple comparisons test. A:****p<0.0001 (n=16) and B: *p=0.0489 (n=6). (C) Primary murine chondrocytes were isolated from NF-κB-luciferase reporter mice. Chondrocytes were then cultured in media containing 4 mM, 2 mM, or 0 mM glutamine for 24 hr. Cells were then treated with IL-1β for 24 hr. NF-κB activity was measured by luciferase assay. n=4. One-way ANOVA was performed followed by Tukey’s multiple comparisons test. ****p<0.0001. (D) Primary murine chondrocytes were cultured in media containing 4 mM glutamine or 0 mM glutamine for 24 hr. Cells were treated with IL-1β for the indicated timepoints. IκB-ζ protein (85kDa) was measured by immunoblotting, with actin (42kDa) used as housekeeping. Image displays representative experiment. (E) Primary murine chondrocytes were cultured in media containing 4mM glutamine or 0 mM glutamine for 24 hr. Cells were then treated with IL-1β (10 ng/mL) for 24 hr. ROS levels were measured by 2’,7’ –dichlorofluorescin diacetate (DCFDA) assay using microplate reader. n=6. One-way ANOVA was performed followed by Tukey’s multiple comparisons test. ****p<0.0001. (F) Primary chondrocytes were cultured in media containing glutamine and supplemented with ammonium chloride at the indicated concentrations for 24 hr in the presence of IL-1β. IκB-ζ protein was measured by immunoblotting. (G–H) Primary chondrocytes were cultured in media containing 4 mM or 0 mM glutamine for 6 hr. Cells were then supplemented with or without 2 mM ammonium chloride. IL-1β stimulation was performed for 24 hr. Gene expression of Il6 and Mmp13 was measured by qPCR. n=4. One-way ANOVA was performed followed by Tukey’s multiple comparisons test. G: ****p<0.0001, **p=0.0065, and H: **p=0.0096, ***p=0.0005.

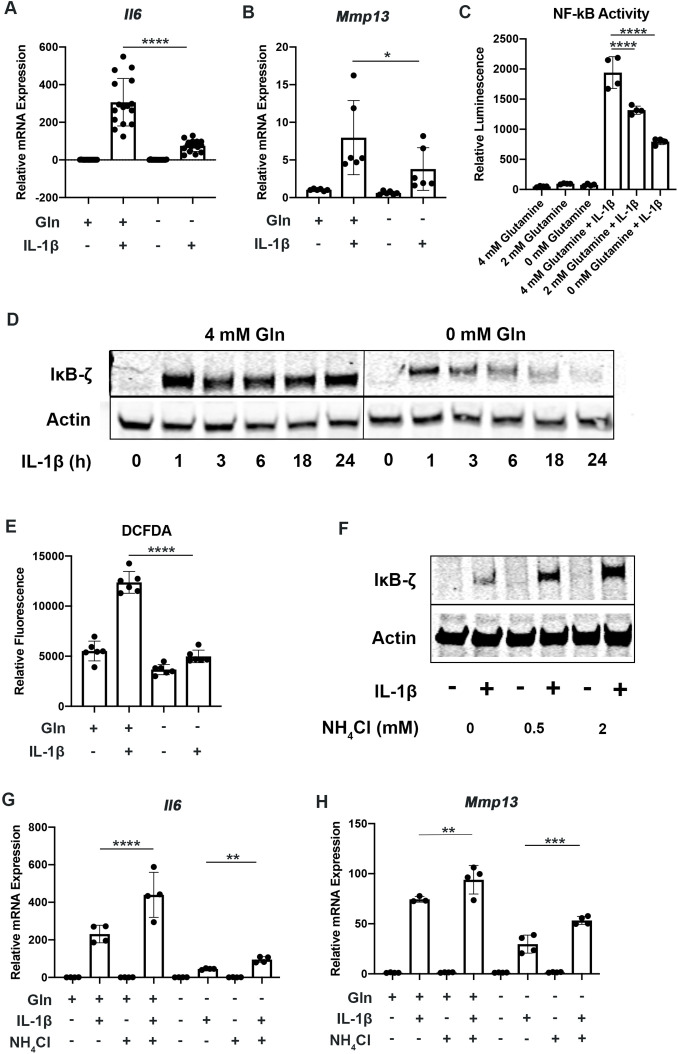
Figure 3—source data 1. Depicting original raw data related to Figure 3.
Figure 3—source data 2. Original raw data for Figure 3D, F.

Figure 3.

Figure 3—figure supplement 1. Glutamine deprivation inhibits the inflammatory response.

Figure 3—figure supplement 1.

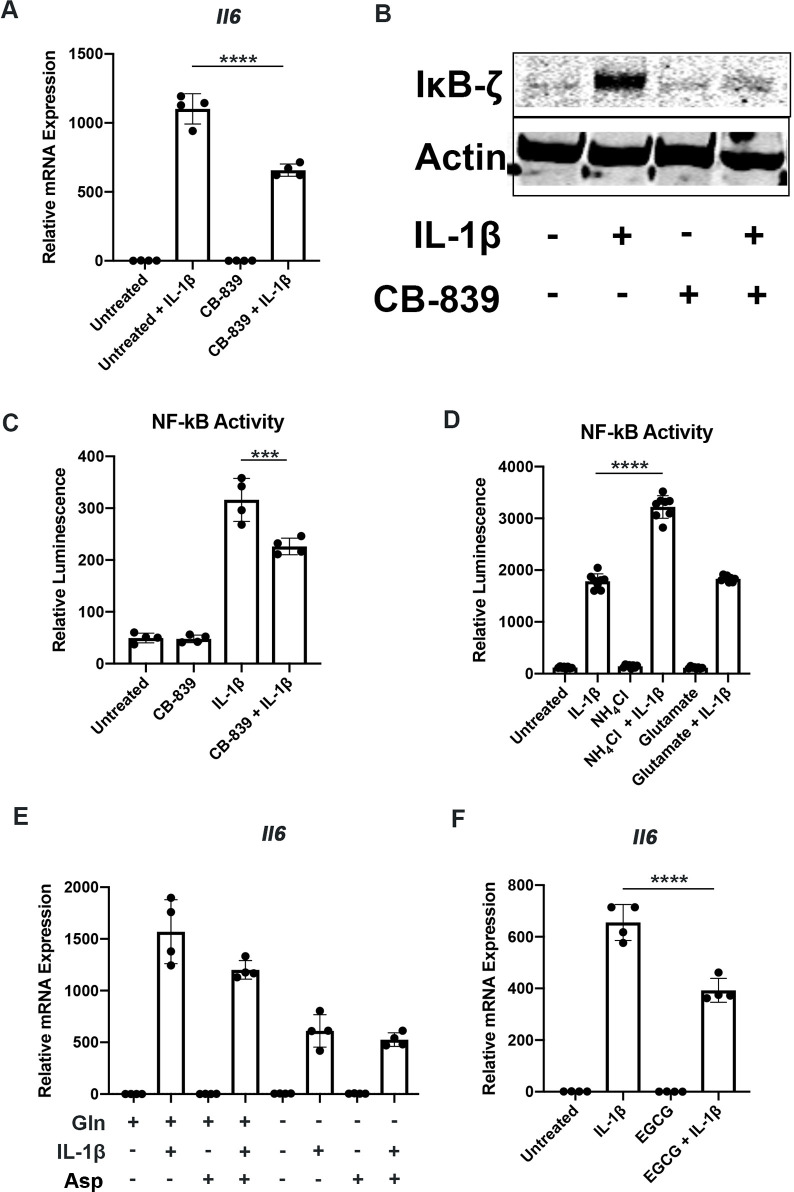
(A) Primary murine chondrocytes were treated with IL-1β in the presence or absence of CB-839 (1 mM) for 24 hr. Gene expression of Il6 was measured by quantitative PCR (qPCR). Results are representative of one experiment. n=4. One-way ANOVA was performed followed by Tukey’s multiple comparisons test. ****p<0.0001. (B) Under similar conditions, IκB-ζ protein (85kDa) levels were measured by immunoblotting. (C) Primary NF-κB-luciferase reporter chondrocytes were treated with IL-1β in the presence or absence of CB-839 (1 mM) for 24 hr. NF-κB activity was measured by luciferase assay. One-way ANOVA was performed followed by Tukey’s multiple comparisons test. ***p=0.0007 (D) Primary NF-κB-luciferase reporter chondrocytes were treated with IL-1β in the presence or absence of ammonium chloride (2 mM) or glutamate (200 μM). NF-κB activity was measured by luminescent luciferase assay. n=8. One-way ANOVA was performed followed by Tukey’s multiple comparisons test. ****p<0.0001. (E) Primary chondrocytes were cultured in media containing 4 mM or 0 mM glutamine for 6 hr. Cells were then supplemented with or without asparagine (1 mM) dissolved in PBS (IL-1β stimulation was performed for 24 hr). Gene expression of Il6 was measured by qPCR. n=4. One-way ANOVA was performed followed by Tukey’s multiple comparisons test. p>0.05. (F) Chondrocytes were treated with IL-1β in the presence or absence of Epigallocatechin 3-gallate (ECGC) for 24 hr. Gene expression of Il6 was measured by qPCR. Results are representative of one experiment. n=4. One-way ANOVA was performed followed by Tukey’s multiple comparisons test. ****p<0.0001.
Figure 3—figure supplement 1—source data 1. Depicting original raw data related to Figure 3—figure supplement 1.
Figure 3—figure supplement 1—source data 2. Original raw data related to Figure 3—figure supplement 1B.