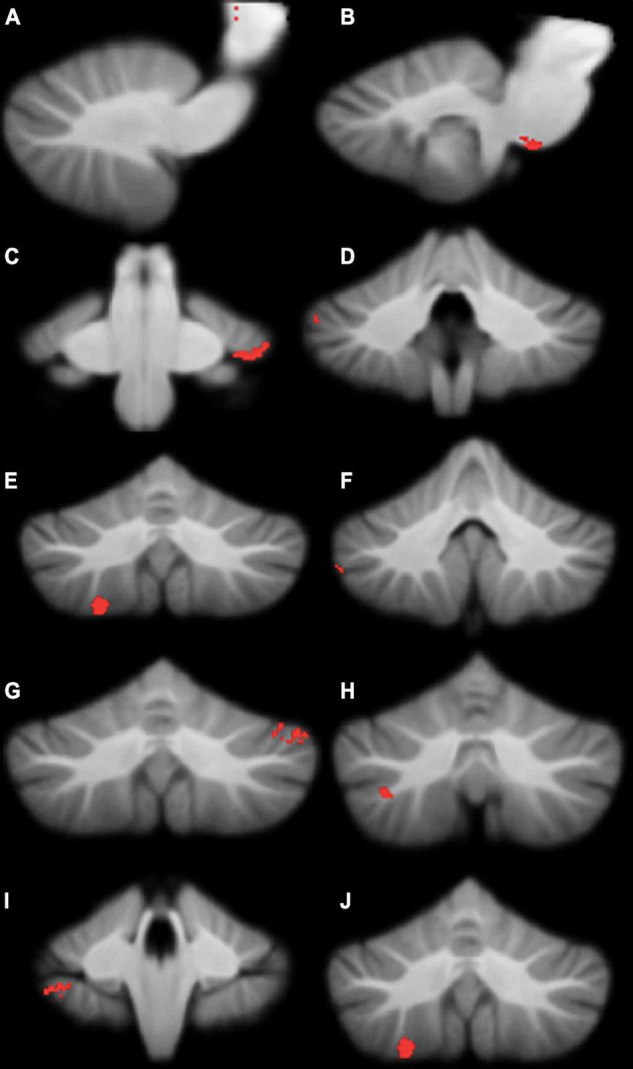
FIGURE 2.

Significant grey matter reductions in children with developmental coordination disorder (DCD) in comparison to typically-developing children. (A) brainstem; (B) brainstem; (C) left lobule VI; (D) right crus I; (E) right crus I; (F) right crus I; (G) left crus I; (H) right crus II; (I) right lobule VIIb; (J) right lobule VIIIa. All results reported with threshold free cluster enhancement (TFCE) correction, uncorrected across contrast at p < 0.01; cluster size threshold at 50 voxels.
