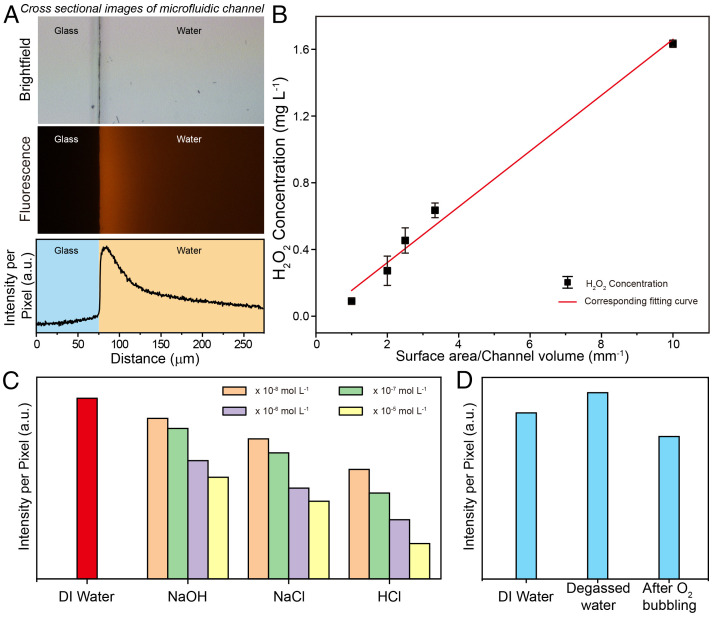
Fig. 2.
Spontaneous generation of H2O2 at water–solid interface. (A) The fluorescent profiles of the spontaneous generation of H2O2 along the normal direction of the substrate (Top, the optical microscopy image of a typical straight channel; Middle, the corresponding fluorescence image; Bottom, the corresponding fluorescence intensity). (B) The correlation between generated H2O2 concentration and surface area/channel volume. Note that the measurements were carried out in capillary devices with various diameters. (C) H2O2 concentration as a function of different pH values and ionic strengths. (D) Dependence of H2O2 generation on dissolving different gases in water.

