Fig. 6.
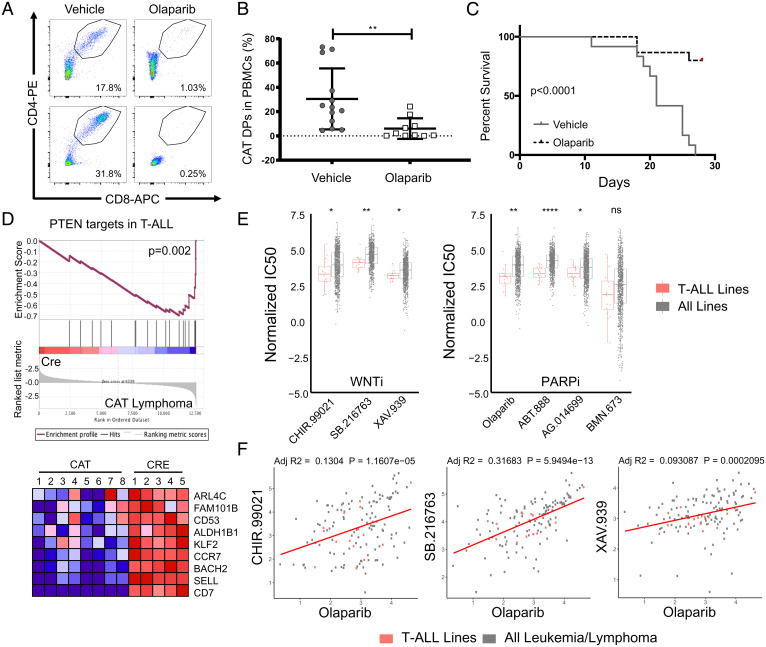
CAT lymphomas and T-ALL cell lines are sensitive to Parp inhibitors. (A) Representative flow cytometry pseudocolor dot plots and (B) cumulative quantification of engraftment flow of live, CD4+CD8+ DPs in peripheral blood (PB) of Rag−/− mice (n = 10/donor) that received CAT lymphomas (n = 3). PB was sampled 2-wk posttransfer during treatment course, with recipients split evenly between olaparib (50 mg/kg/day) or vehicle controls. Data are represented as the mean ± SEM and statistical testing is depicted as two-sided, unpaired t tests; **P ≤ 0.01. (C) Kaplan–Meier survival curve of CAT lymphoma recipients in the indicated conditions. (D) GSEA comparing PTEN targets in T-ALL (44) to RNA expression profile derived from five CAT lymphoma samples. Heat map shows genes at the leading edge of the GSEA. (E) Normalized IC50 data from the GDSC database comparing T-ALL cell line (n = 16) sensitivity to all cancer cell lines (n = 974) for inhibitors targeting Wnt (WNTi) or Parp (PARPi), as indicated. Data are represented as the mean ± SEM, and statistical testing is depicted as two-sided, unpaired t tests; *P ≤ 0.05, **P ≤ 0.01, ****P ≤ 0.0001. (F) Correlations of olaparib sensitivity (IC50) to WNTi compounds in all leukemia and lymphoma cell lines (n = 150) with T-ALL lines highlighted (n = 16, red). Linear regressions analysis was performed in R, assuming Gaussian distribution and correlations represented as adjusted R-squared values (adj R2).

