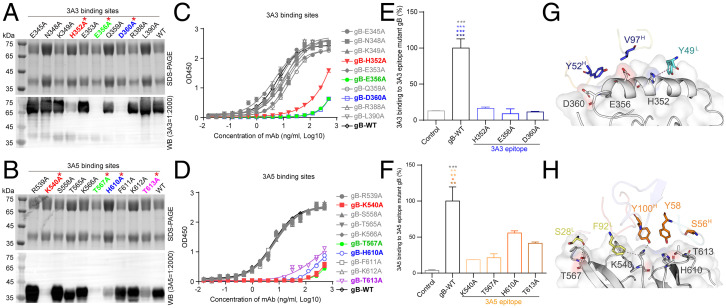
Fig. 6.
Validation of key residues located at the gB:3A3 and gB:3A5 interfaces. (A and B) Reducing sodium dodecyl sulfate-polyacrylamide gel electrophoresis (SDS-PAGE) and WB of purified recombinant mutant and gB-WT proteins as indicated with anti-gB antibodies 3A3 (A) and 3A5 (B). (C and D) The binding activities of the mutant and gB-WT to 3A3 (C) and 3A5 (D) were determined by ELISA. (E and F) The 293T cells bound with 3A3 (E) or 3A5 (F) were stained with the AF647 goat anti-rabbit IgG secondary antibody and measured by flow cytometry. The 293T cells expressing full-length gB-WT, 3A3, or 3A5 epitope mutants and the control cells transfected with the empty vector are indicated. Antibody staining was performed without cell membrane permeabilization. The level of antibody binding to 293T cells expressing gB-WT and each gB mutant was first normalized to the membrane expression level of gB-WT and each gB mutant, respectively, and then, all values were normalized as a percentage to gB-WT. Statistical analyses were performed using one-way ANOVA. Data in C-F are represented as the mean of two independent replicates ± SEM. (G and H) Key amino acid interactions at the gB:3A3 (E) and gB:3A5 (F) interfaces. The color of the asterisks denotes the group with which there is a significant difference determined by a Sidak multiple comparison test. *P ≤ 0.0332; **P ≤ 0.0021; ***P ≤ 0.0002. Red asterisks represent key residues recognized by 3A3 and 3A5.

