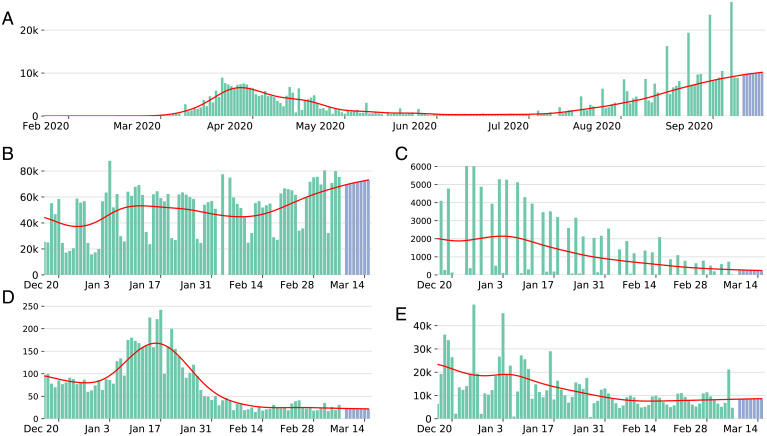
Fig. 1.
Green bars correspond to daily cases. Blue bars show the forecast for the next 7 d. The red line shows the estimated trend smoothed together with the forecast. (A) JHU daily cases for Spain with forecasts starting from September 10, 2020, with a negative observation in June 2020 (not shown in the plot), visible outliers, and seasonality patterns in reporting starting from July. Daily cases in the last 3 mo preceding December 3, 2021, for (B) Brazil, (C) Kansas, (D) China, and (E) Germany. Shown are the observed number of cases (green), estimated trend (red), and trend forecast for the following week (blue).

