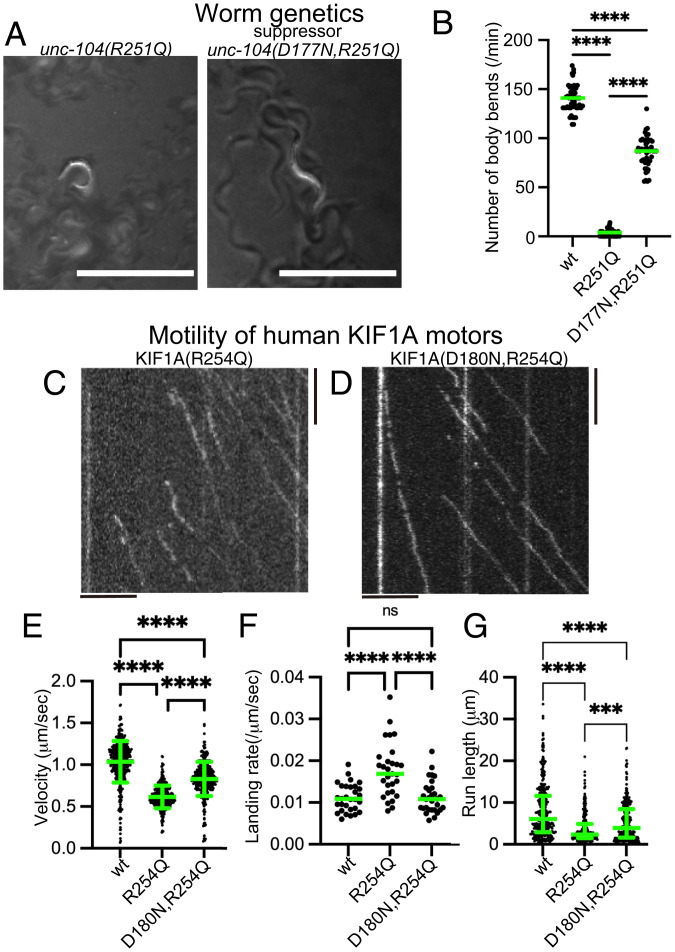
Fig. 4.
Suppressor screening. (A) Macroscopic phenotypes of unc-104(R251Q) and a suppressor mutant unc-104(D177N, R251Q). While unc-104(R251Q) worms do not move well on the bacterial feeder, unc-104(D177N, R251Q) worms move smoothly. Bars, 1 mm. (B) Dot plots showing the result of swim test. The number of body bends in a water drop was counted for 1 min and plotted. Dots represents the number of bends from each worm. Green bars represent median value. Kruskal–Wallis test followed by Dunn’s multiple comparison test. n = 20 worms for each genotype. ****, Adjusted P value of <0.0001. (C and D) Representative kymographs showing the motility of 10 pM human KIF1A(R254Q) protein (C) and KIF1A(D180N, R254Q) protein (D) on microtubules. Vertical and horizontal bars represent 5 s and 5 μm, respectively. (E) Dot plots showing the velocity of KIF1A. Dot shows the actual value from each data point. Green bars represent mean ± SD. Kruskal–Wallis test followed by Dunn’s multiple comparison test. n = 433 (wt), 325 (R254Q), and 368 (D180N, R254Q). ****, Adjusted P value of <0.0001. (F) Dot plots showing the landing rate of KIF1A. The number of KIF1A that bound to microtubules was counted and adjusted by the time window and microtubule length. Green bars represent median value. Kruskal–-Wallis test followed by Dunn’s multiple comparison test. n = 30 (10 pM wt), 29 (10 pM R254Q), and 30 (10 pM D180N, R254Q). ****, Adjusted P value of <0.0001. (G) Dot plots showing the run length of KIF1A. Green bars represent median value and interquartile range. Kruskal–Wallis test followed by Dunn’s multiple comparison test. n = 312 (wt), 241 (R254Q), and 312 (D180N, R254Q) homodimers. ****, Adjusted P value of <0.0001. Note that the reported run lengths are an underestimation of the motor’s processivity. as described in Fig. 3J and that KIF1A(wt) and KIF1A(R254Q) values are the same with Fig. 3. See also SI Appendix, Fig. S4.

