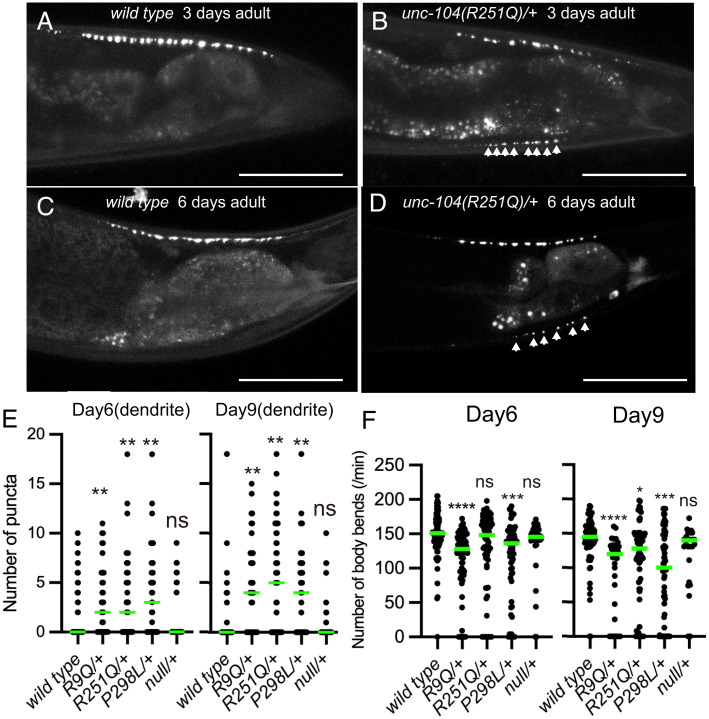
Fig. 5.
Synaptic vesicle localization of heterozygotes. (A–D) Representative images showing synaptic vesicle distribution in 3-d wild-type adult (A), 3-d unc-104(R251Q)/+ adult (B), 6-d wild-type adult (C), and 6-d unc-104(R251Q)/+ adult (D). Synaptic vesicles are visualized by GFP::RAB-3. Arrowheads show mislocalization of synaptic vesicles in the dendrite. Bars, 50 μm. (E) Dot plots showing the number of dendritic puncta at 6 and 9 d. Each dot shows the number of puncta in the dendrite in each worm. Green bars represent median value. Kruskal–Wallis test followed by Dunn’s multiple comparison test. n = 59 (wt), 36 (R9Q/+), 46 (R251Q/+), 39 (P298L/+), and 40 (null/+) (6-d adult worms); 58 (wt), 38 (R9Q/+), 49 (R251Q/+), 40 (P298L/+), and 43 (null/+) (9-d adult worms). ns, adjusted P value of >0.05 and statistically not significant. **, Adjusted P value of <0.01. (F) Dot plots showing the result of swim test at 6 and 9 d. Each dot shows the number of bends in each measurement. Green bars represent median value. Kruskal–Wallis test followed by Dunn’s multiple comparison test. n = 76 (wt), 87 (R9Q/+), 74 (R251Q/+), 65 (P298L/+), and 38 (null/+) (6-d adult worms); 66 (wt), 30 (R9Q/+), 65 (R251Q/+), 67 (P298L/+), and 27 (null/+) (9-d adult worms). ns, adjusted P value of >0.05 and statistically not significant. *, Adjusted P value of <0.05. **, Adjusted P value of <0.01. ****, Adjusted P value of <0.0001. See also SI Appendix, Fig. S5.

