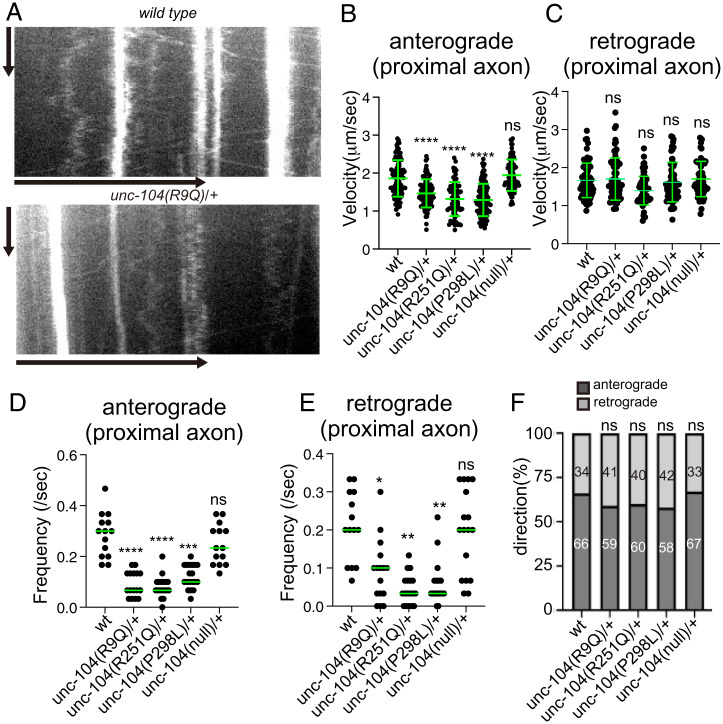
Fig. 6.
Axonal transport in KAND model heterozygotes (A) Representative kymographs showing axonal transport of synaptic vesicle precursors in wild type and unc-104(R9Q)/+ at 1 d adults. GFP::RAB-3 was used as a marker. Vertical and horizontal bars show 10 s and 10 μm, respectively. (B and C) The velocity of axonal transport. The velocity of anterograde transport (B) and retrograde transport (C) are shown as dot plots. (B) Kruskal–Wallis test followed by Dunn’s multiple comparison test. Green bars show mean ± SD n = 94 (wild type), 90 (R9Q/+), 66 (R251Q/+), 117 (P298L/+) and 84 (null/+) vesicles from at least 5 independent worms. ns, Adjusted P value > 0.05 and no significant statistical difference. ****, Adjusted P value < 0.0001. (C) Kruskal-Wallis test followed by Dunn's multiple comparison test. Green bars show mean ± SD; n = 70 (wild type), 70 (R9Q/+), 68 (R251Q/+), 63 (P298L/+), and 65 (null/+) vesicles from at least 5 independent worms. ns, adjusted P value of >0.05 and no significant statistical difference. (D and E) Frequency of axonal transport. The frequency of anterograde transport (D) and retrograde transport (E) are shown as dot plots. (E) Kruskal–Wallis test followed by Dunn’s multiple comparison test. Each dot represent data from each worm. Green bars represent median value. n = 14 (wt), 16 (R9Q/+), 18 (R251Q/+), and 19 (P298L/+) independent worms. ****, Adjusted P value of <0.0001. (E) Kruskal–Wallis test followed by Dunn’s multiple comparison test. Each dot represent data from each worm. Green bars represent median value. n = 14 (wt), 16 (R9Q/+), 18 (R251Q/+), and 19 (P298L/+) independent worms. **, Adjusted P value of <0.01; ****, Adjusted P value of <0.0001. (F) Directionality of vesicle movement. The number in the bar graph shows the actual percentage. ns, Adjusted P value of >0.05 and statistically not significant. χ2 test. Compared to wt worms. See also SI Appendix, Fig. S6.

