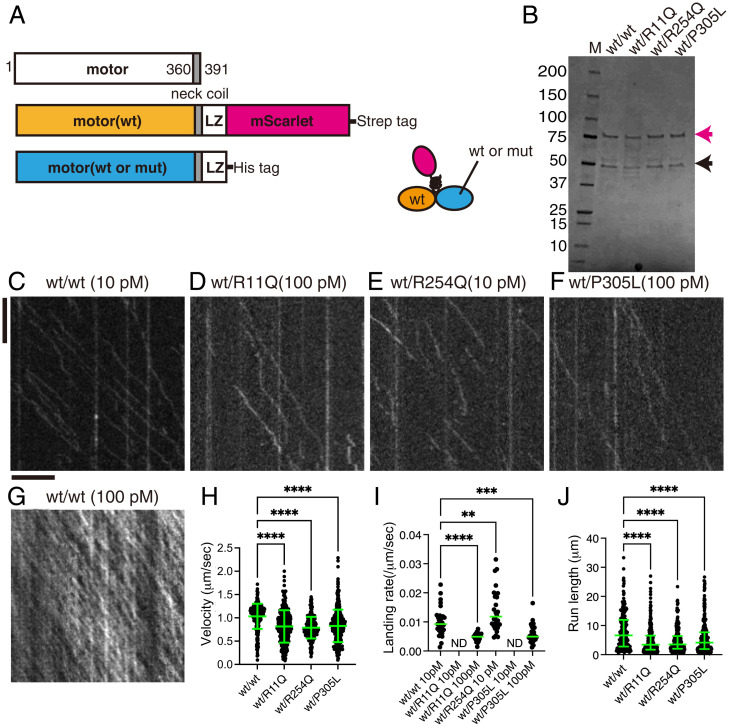
Fig. 7.
The single-molecule behavior of wild-type/mutant KIF1A heterodimers. (A) Schematic drawing of the recombinant KIF1A heterodimer analyzed. (B) Purified KIF1A(1–393)::LZ::mScarlet/KIF1A(1–393)::LZ heterodimers were separated by SDS-PAGE and detected by Coomassie brilliant blue staining. M represents marker. Numbers on the left indicate the molecular weight (kDa). Magenta and black arrows indicate KIF1A(1–393)::LZ::mScarlet and KIF1A(1–393)::LZ, respectively. (C–G) Representative kymographs showing the motility of 10 pM KIF1A (wt) (C), 100 pM KIF1A(R11Q) (D), 10 pM KIF1A(R254Q) (E), 100 pM KIF1A(P305L) (F), and 100 pM KIF1A (wt) (G). Vertical and horizontal bars represent 5 s and 5 μm, respectively. (H) Dot plots showing the velocity of KIF1A. Each dot shows a single datum point. Green bars represent mean ± SD. Kruskal–Wallis test followed by Dunn’s multiple comparison test. n = 308 (wt/wt), 315 (wt/R11Q), 294 (wt/R254Q), and 414 (wt/P305L) heterodimers. ****, Adjusted P value of <0.0001. (I) Dot plots showing the landing rate of KIF1A. The number of KIF1A that binds to microtubules was counted and adjusted by the time window and microtubule length. Each dot shows a single datum point. Green bars represent median value. Kruskal–Wallis test followed by Dunn’s multiple comparison test. n = 29 (10 pM wt/wt), 29 (100 pM wt/R11Q), 28 (10 pM wt/R254Q),and 38 (100 pM wt/P305L) independent observations. **, Adjusted P value of <0.01; ***, adjusted P value of <0.001; ****, adjusted P value of <0.0001. (J) Dot plots showing the run length of KIF1A. Each dot shows a single datum point. Green bars represent median value and interquartile range. Kruskal–Wallis test followed by Dunn’s multiple comparison test. n = 215 (wt/wt), 241 (wt/R11Q), 195 (wt/R254Q), and 266 (wt/P305L) heterodimers. ****, Adjusted P value of <0.0001. Note that the reported run lengths are an underestimation of the motor’s processivity as described in Fig. 3J. See also SI Appendix, Fig. S7.

