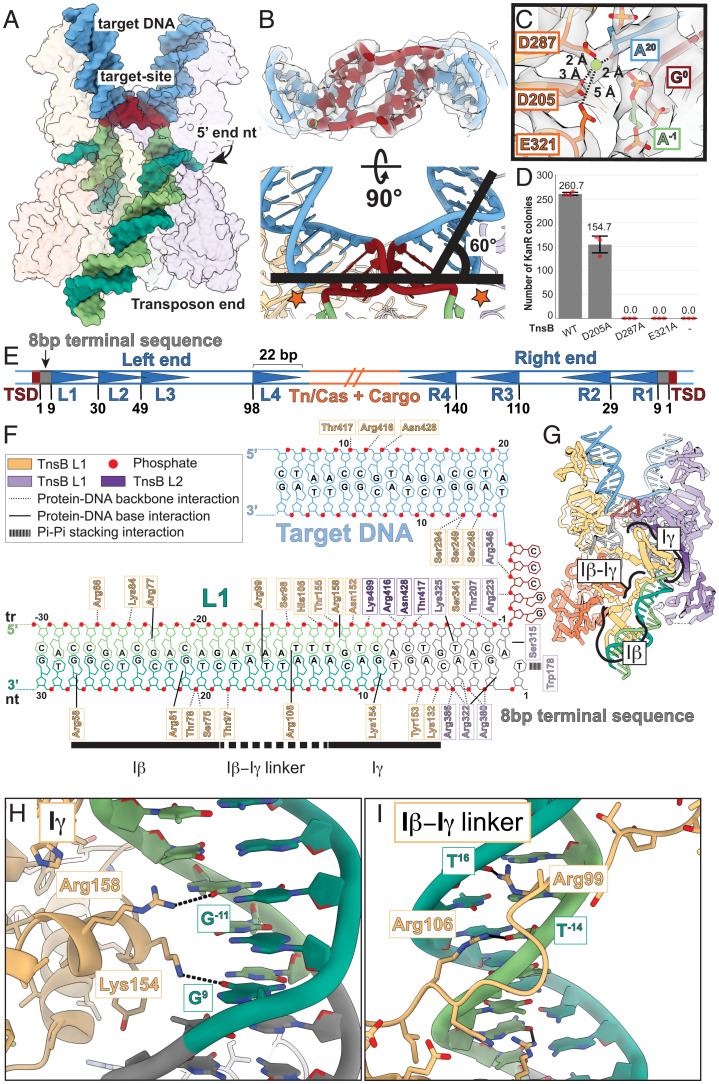
Fig. 3.
Target-DNA distortions and transposon end-binding sequence requirements are revealed in the TnsB STC. (A) Atomic model of the strand-transfer DNA. Protein is shown with a transparent surface. Target DNA colored is blue; the target site is colored brown. Transposon end DNA is colored in different shades of green: The transferred strand (tr) is colored light green; the nontransferred strand (nt) is colored dark green. (B) Target DNA (brown) is highly distorted, bent at each end by 60°. Stars indicate the target–donor junction. (C) DDE catalytic residues (orange) are displayed along with distances to the Mg2+ ion (dashed line), close to the scissile phosphate on the strand-transfer substrate. Cryo-EM map density is shown in transparent surface. (D) Alanine mutation of the catalytic residues (D205A, D287A, and E321A) results in significant loss of transposition activity. Negative control without TnsB is indicated as “-.” Transposition activity was assessed by the number of KanR transformants. Data are represented by the mean; error bars indicate SD (n = 3, technical triplicates). Raw data points are shown in red. (E) The structure of ShCAST transposon ends following integration. The target-site duplication (TSD; brown) is adjacent to an 8-bp terminal sequence (gray) and flanked by multiple TnsB binding sites (blue triangles). Flanking host target DNA is shown in light blue, and transposon/CRISPR–associated (Tn/Cas) genes and cargo DNA are in orange. ShCAST transposon ends are characterized by four unevenly and nonsymmetrically spaced TnsB binding sites (represented as blue triangles, L1 to L4 and R1 to R4). Base pair positions (numbered) indicate the start of each TnsB binding site. (F) Diagram of protein–DNA interactions made within the STC core, along the 8-bp terminal sequence, and the first TnsB binding site. Both base-specific contacts (solid line) and interactions with the sugar-phosphate backbone (dashed line) are made throughout the terminal inverted repeat as well as with the target DNA. Notable pi–pi stacking arrangements (indicated with a wide dashed line) are also shown, which interact with the 5′ end of the nontransferred strand. Domains of TnsB that interact with the L1 TnsB-binding sequence are marked. (G) Specific domains in TnsB (Iβ, Iγ, and Iβ–Iγ linker) are indicated in the model overview, which are shown as close-up insets in H and I. (H and I) Base-specific contacts are made throughout the TnsB binding site with the TnsB Iγ domain (H) and TnsB Iβ–Iγ linker (I), highlighting the mechanistic basis of transposon end recognition by TnsB. Possible hydrogen-bonding interactions are indicated with dashed black lines.

