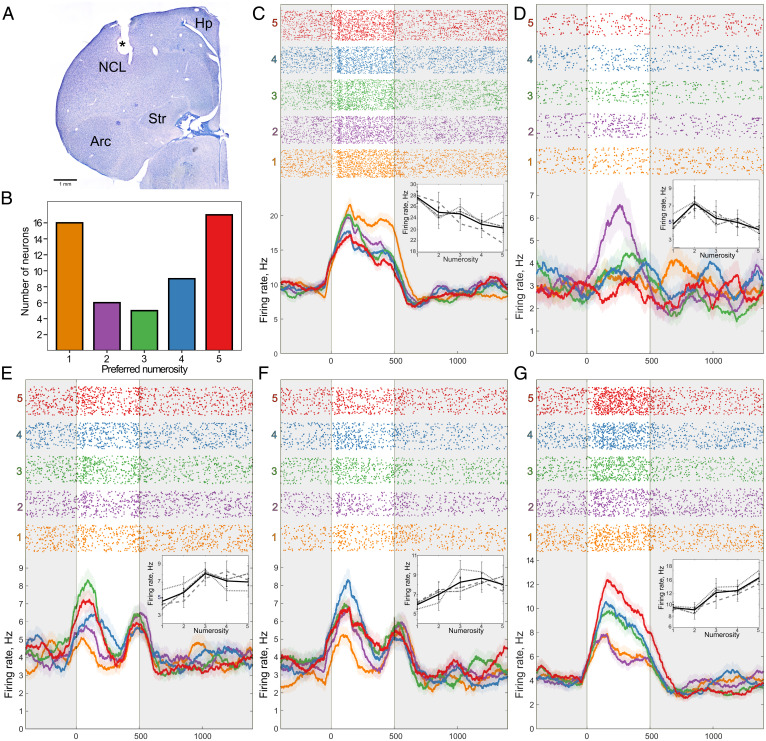
Fig. 2.
Neurons in the NCL of chicks responding to numerosity. (A) An exemplary coronal section of the chicken forebrain showing the recording site in the NCL (electrolytic lesion is marked by an asterisk). Arc, arcopallium; Hp, hippocampus; Str, striatum. (B) Distribution of neurons that preferred each numerosity stimulus. Examples of neurons that were tuned to numerosity one (C), two (D), three (E), four (F), or five (G). (Top) Raster plots representing neural activity, where each line corresponds to one trial, and each dot corresponds to a spike. Trials are grouped by numerosity. The 500-ms duration of the stimulus is marked by a transparent window. (Bottom) Averaged spike density functions (smoothed by a 100-ms Gaussian kernel; SEM is plotted as a shaded area along the lines). (Insert) Average firing rate in response to numerosities of each stimulus type. Gray dotted line corresponds to “radius-fixed,” dashed line corresponds to “perimeter-fixed,” dot-dashed line corresponds to “area-fixed” stimuli, and black solid line corresponds to an average. Error bars correspond to SEM.

