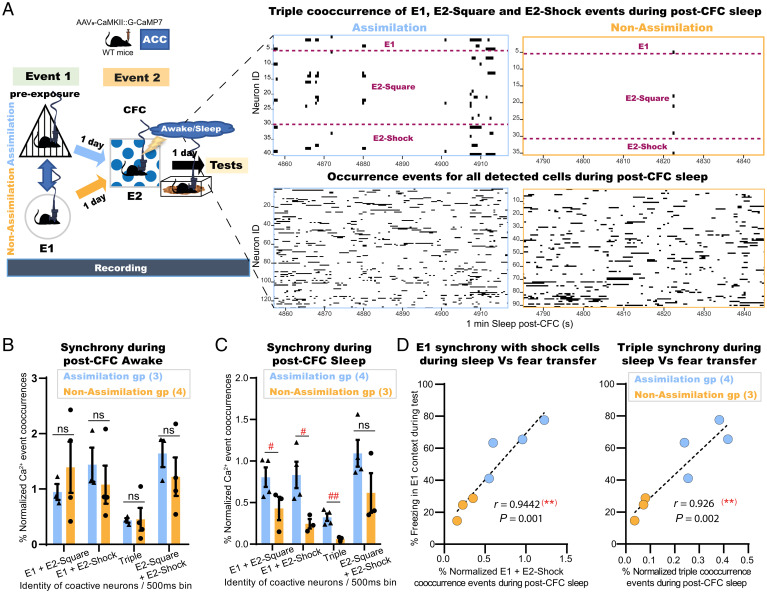
Fig. 5.
Coreactivations of related memory representations in the ACC emerge during postlearning sleep. (A) (Left) Experimental design. (Right) Representative plots for 1 min of post-CFC sleep in the assimilation (blue) and nonassimilation (yellow) groups depicting either the synchronized Ca2+ transients for the triple cooccurrence events of E1, E2-Shock, and E2-Square neurons (Top) or the occurrence events of all detected neurons (Bottom). (B) Percent normalized Ca2+ event cooccurrences of either E1-responsive cells with E2-responsive cells or E2-Square with E2-Shock responsive cells within 2 min post-CFC awake. (C) Percent normalized Ca2+ event cooccurrences of either E1-responsive cells with E2-responsive cells or E2-Square with E2-Shock responsive cells within 2 min post-CFC sleep composed of the first minute of each NREM and REM period. Data are presented as mean ± SEM. P values were determined using unpaired t test; (##P < 0.01, #P < 0.05). (D) Individual percent freezing during test in the E1 context, as in Fig. 4B, and the synchronized Ca2+ events of E1 cells with that of E2-Shock cells alone (Left) or with that of both E2-Square and E2-Shock cells (Right) during sleep, as in C; dashed black line, linear fit; (Inset) Pearson’s (r) value and P value (two-tailed).

