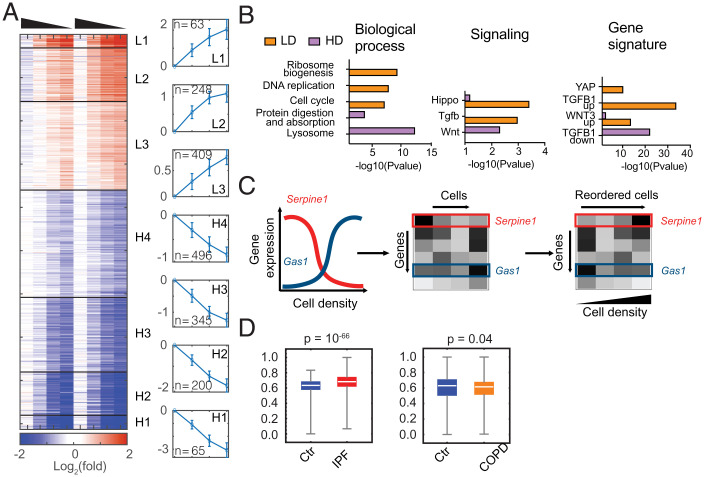
Fig. 2.
Fibroblasts exhibit density-dependent gene expression. (A) Heatmap showing relative expression of density-dependent genes in MEFs from two sets of biological replicates. Gene expression (TPM) is normalized to the average of two replicates at 10K density and shown after log2 transformation. Genes are clustered into seven groups using unsupervised K-mean clustering, organized from the most induced at low density to the most induced at high cell density. The average log2 fold-change of each cluster and the number of genes is shown on the right. Density of cells is indicated by the triangle above the heatmap, high to low. (B) Functional enrichment analyses of biological processes, Kyoto Encyclopedia of Genes and Genomes (KEGG) signaling pathways, and molecular signatures for genes induced in low density (LD) or high density (HD). (C) Using landmark genes that are density-dependent, cells in single-cell gene-expression data can be reordered along a pseudo density axis to find new density-dependent gene programs. (D) Violin plots showing the distribution of calculated cell density scores for single-cell RNA-seq of human fibroblasts extracted from IPF+control and COPD+control groups.

