Fig. 5.
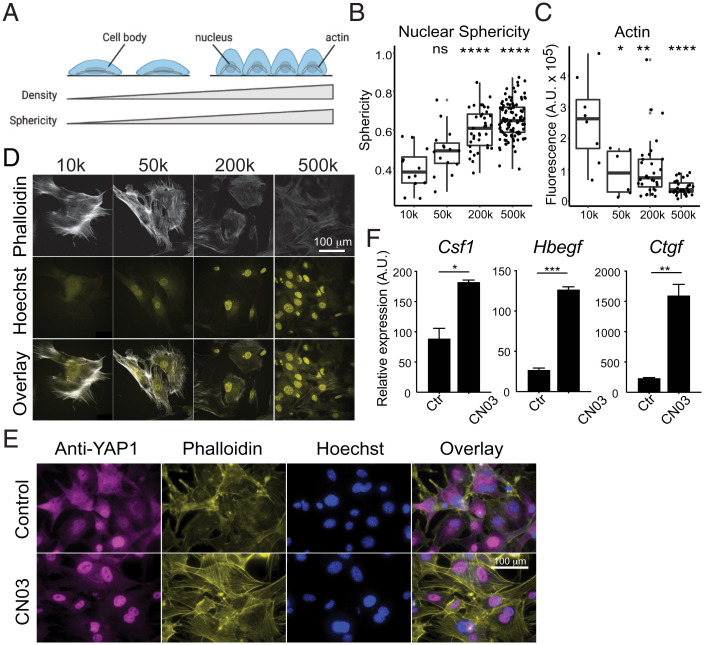
Actin-dependent mechanisms regulate density gene expression. (A) Diagram depicting the relationship between increased nuclear sphericity and increased cell density. (B) Quantification of nuclear sphericity of MEFs, calculated as the ratio between the length and width of a nucleus. Each point represents an individual nucleus. Six images per density were quantified. (C) Confocal images of immunofluorescent staining of actin filaments (phalloidin) in MEFs at different cell densities. (D) Quantification of fluorescence intensity of actin staining at different cell densities. Fluorescence intensity of actin inside the cell is corrected by the background. Each data point represents one cell. (E) Representative immunofluorescence images of YAP1 localization in MEFs after 4 h treatment with CN03. (F) Growth factor expression in MEFs after 4 h treatment with Rho activator (CN03 peptide). Wilcox t test. ns, P > 0.05, *P < 0.05, **P < 0.01, ***P < 0.001, ****P < 0.0001.

