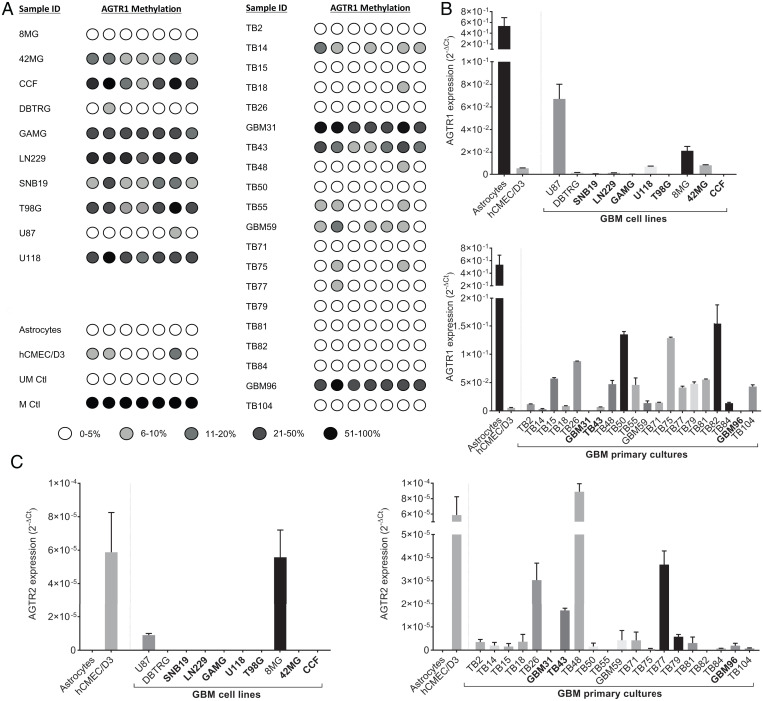
Fig. 1.
Expression profiling of AGTR1 and AGTR2 in GBM. (A) AGTR1 CpG island methylation was determined by pyrosequencing in established GBM cell lines (8MG, 42MG, CCF, DBTRG, GAMG, LN229, SNB19, T98G, U87, U118) and patient-derived primary GBM cell cultures (TB2, TB14, TB14, TB18, TB26, GBM31, TB43, TB48, TB50, TB55, GBM59, TB71, TB75, TB77, TB79, TB81, TB82, TB84, GBM96, TB104). DNA extracted from cultured primary fetal astrocytes and human brain microvascular cells (hCMEC/D3) were also included in the analysis, as well as unmethylated placental (UM) and methylated (M) control DNA. (B) qPCR analysis of AGTR1 in established GBM cell lines and GBM primary cultures. (C) qPCR analysis of AGTR2. Expression data were normalized to the reference genes (TBP and HPRT1) and presented as 2-ΔCt. Ctl, control.

