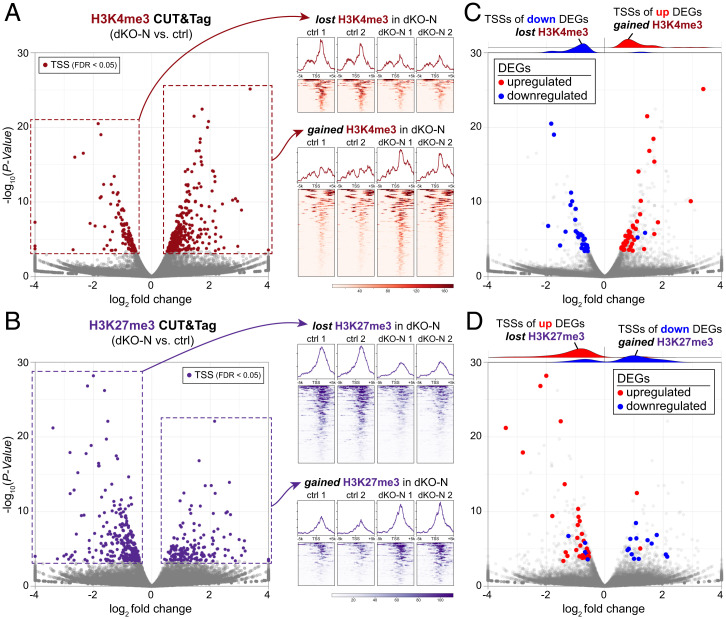
Fig. 3.
Disrupted histone modifications following H3f3a and H3f3b codeletion. (A) Volcano plot of H3K4me3 CUT&Tag signal at annotated TSSs comparing the P0 cortex of dKO-N to control, and normalized H3K4me3 CUT&Tag profiles 5 kb upstream and downstream of TSSs. At FDR < 0.05, 300 TSSs showed significantly altered H3K4me3 in dKO-N (burgundy), 220 gained H3K4me3, and 80 lost H3K4me3. (B) Volcano plot of H3K27me3 CUT&Tag signal at TSSs comparing dKO-N to control, and normalized H3K27me3 CUT&Tag profiles: 275 TSSs showed significantly altered H3K27me3 in dKO-N (purple), 105 gained H3K27me3, and 170 lost H3K27me3. (C and D) Intersectional analysis of significantly altered TSSs and DEGs in dKO-N. Down-regulated DEGs in dKO-N (blue) largely lost the activating mark H3K4me3 (C) at their TSS but gained the repressive mark H3K27me3 (D). Conversely, up-regulated DEGs (red) largely gained the activating mark H3K4me3 at their TSSs but lost the repressive mark H3K27me3. DEGs directionally correlated with PTM changes in dKO-N.

