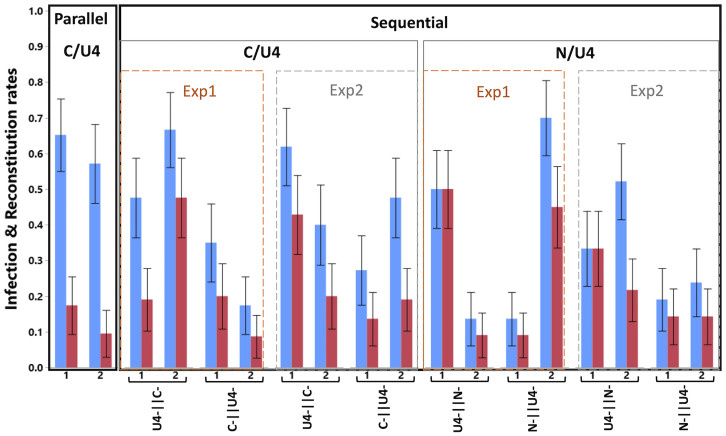
Fig. 2.
Infection and full genome reconstitution as a function of the transmission mode. The graph shows the proportion of infected plants (blue) and plants where all three investigated segments are found (reconstitution, red) as a function of the transmission mode (parallel vs. sequential) and the segments involved (parallel: only U4 and C; sequential: either U4 and C or N and U4; the order of the segments in the labels indicates the order of infected plants on which the aphids fed). For sequential transmission and for a given pair of segments and order, we provide the results from the two different experiments, namely, parallel vs. sequential (Exp 1) and sequential with spacing in time (Exp 2), using for the latter only the 0 spacing time treatments. The two experimental replicates (1, 2) are shown for each case, and the error bars are ±1 SE of the mean. Sample size varies from 20 to 23 (Table 1).

