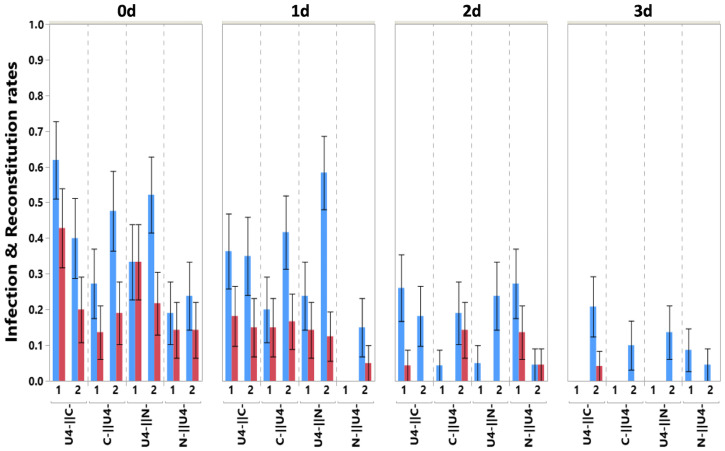
Fig. 3.
Infection and full genome reconstitution as a function of time spacing between sequential acquisitions. Shows the proportion of infected plants (blue) and plants in which all three investigated segments are found (reconstitution, red) as a function of time spacing (top x-axis, expressed in days) for the different segments and order combinations. The two experimental replicates are shown for each case, and the error bars are ±1 SE of the mean. Sample size varies from 17 to 24 (Table 1).

