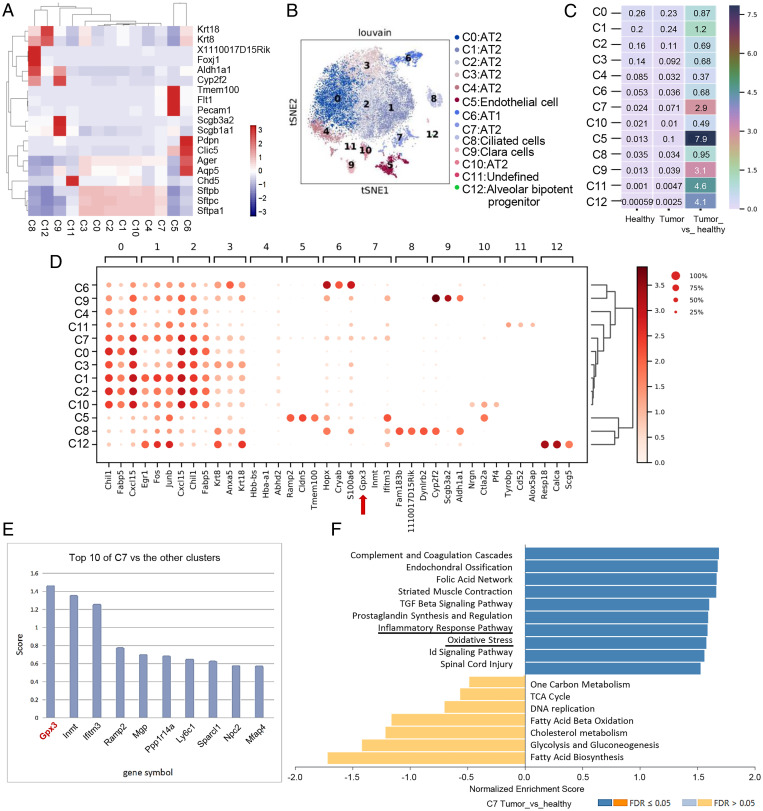
Fig. 1.
Identification of GPX3+ AT2 cells in the lung of tumor-bearing mice by single-cell sequencing. (A) Visualization of clusters with annotated marker genes by heatmap. (B) t-SNE plots show 12 cell clusters of epithelial cells identified by 10× Genomics scRNA-seq. (C) The ratio of each cell type in epithelial cells of LLC tumor-bearing mouse to those of the healthy one by heatmap. (D) Expression of top three genes among each cell type in 12 cell clusters of epithelial cells shown by dot plot with algorithm of Wilcoxon. Red arrow: GPX3. (E) Scores of marker genes by comparing cluster 7 with the rest of the clusters. (F) GSEA of pathway enriched in cluster 7 in lungs of LLC-bearing mouse versus healthy one by WebGestalt (www.webgestalt.org/#) using the database of PANTHER pathway. Id, inhibitor of DNA binding; TCA, tricarboxylic acid cycle; FDR, false discovery rate.

