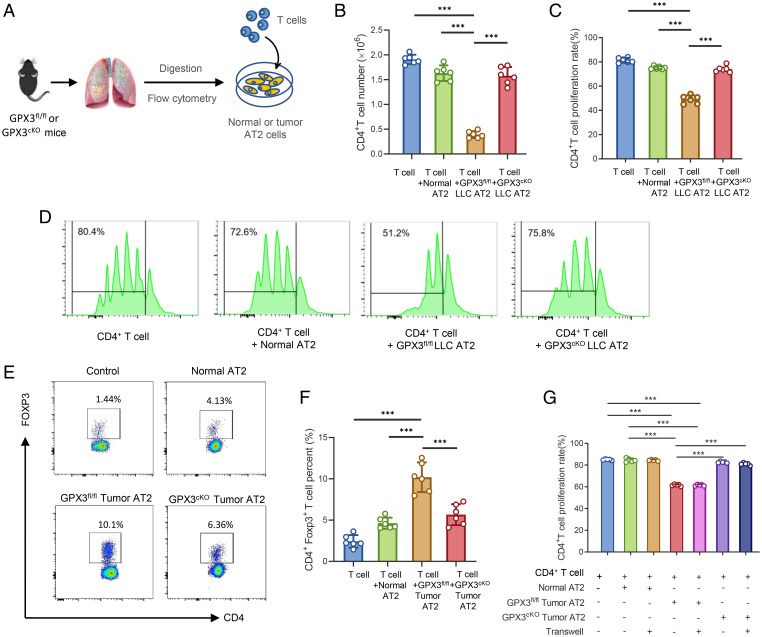
Fig. 3.
Tumor polarizes GPX3+ AT2 cells to suppress T cell responses in a GPX3-dependent way. (A) Model diagram of coculture system for AT2 cells and T cells. (B–D) Flow cytometry analysis of CD4+ T cell number (B), proliferation rate (C), and representative images of CFSE-based proliferation assay (D) of CD4+ T cells cocultured with AT2 cells from healthy, LLC-bearing GPX3fl/fl, or GPX3cKO mice respectively. (E and F) The proportions (E) and absolute numbers (F) of Treg cells were detected by flow cytometry after CD4+ T cells cocultured with AT2 cells as in B. (G) The flow cytometry analysis of CD4+ T cell proliferation after cocultured with different AT2 cells with or without transwells (two-way ANOVA). Data are mean ± SD of one representative experiment. Similar results were seen in three independent experiments. Unpaired Student’s t tests unless noted. ***P < 0.001.

