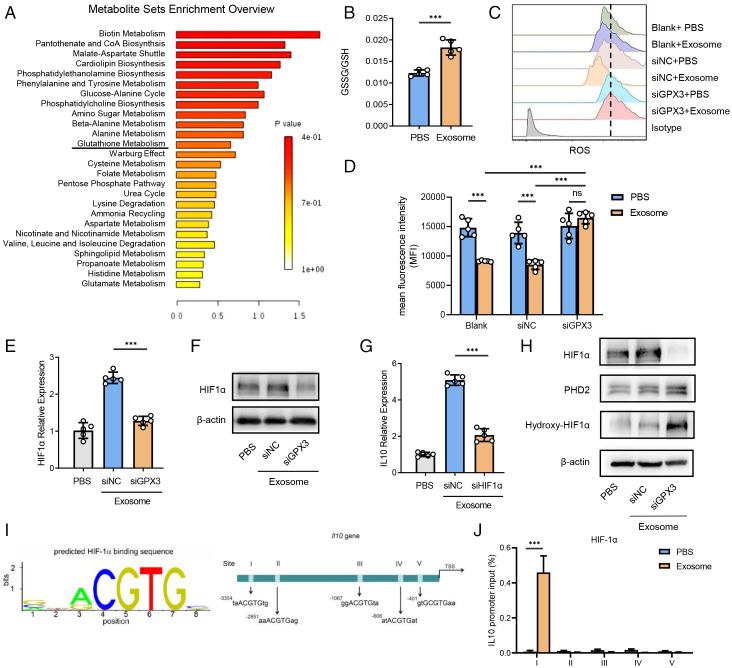
Fig. 5.
GPX3 stabilizes HIF-1α and promotes HIF-1α-dependent IL-10 induction in AT2 cells. (A) Metabolite sets enrichment of metabolome by comparing the whole lungs of LLC-bearing mice with those of healthy ones. CoA, coenzyme A. (B) The proportion of GSSG/GSH of MLE-12 cells stimulated with tumor exosomes as detected by glutathione assay kit. (C and D) Representative histograms (C) and mean fluorescent intensity (MFI) (D) showing ROS levels of control or GPX3-silenced MLE-12 cells treated with or without tumor exosomes as detected by flow cytometry. The dashed line refers to the highest MFI. (E and F) Messenger RNA (mRNA) expression (E) and protein level (F) of HIF-1α expression in control or GPX3-silenced MLE-12 cells treated with or without tumor exosomes for 2 h. β-actin was used as a control. siNC, silence of negative control; siGPX3, silence of GPX3; siHIF1α, silence of HIF1α. (G) mRNA expression of IL-10 in control or HIF1α-silenced MLE-12 cells treated with or without tumor exosomes for 2 h. (H) The protein level of HIF-1α, PHD2, and hydroxy-HIF-1α in normal or GPX3-silenced MLE-12 cells treated with or without tumor exosomes. (I) Five possible HIF-1α-binding sites containing motif (ACGTG) in IL-10 promoter region. TSS, transcription start site. (J) ChIP analysis of HIF-1α-binding sites in IL-10 promoter region of MLE-12 cells treated with tumor exosomes. Immunoglobulin G was used as a control. Data are mean ± SD of one representative experiment. Similar results were seen in three independent experiments. Unpaired Student’s t tests unless noted. ***P < 0.001. ns, not significant.

