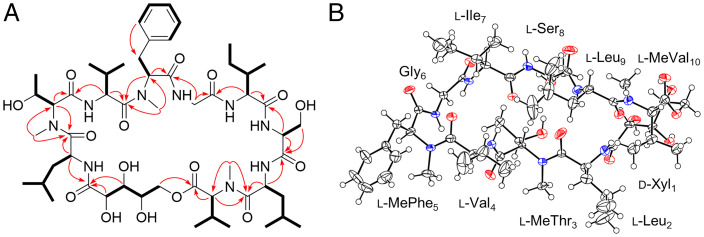
Fig. 2.
Structure elucidation of xylomyrocin C (3). (A) Key 1H-1H TOCSY/COSY (bold lines) and HMBC (plain arrows) correlations of 3. (B) Oak Ridge Thermal-Ellipsoid Plot Program (ORTEP) representation of 3 obtained from X-ray crystallographic analysis. Red and blue circles represent O and N atoms, respectively.

