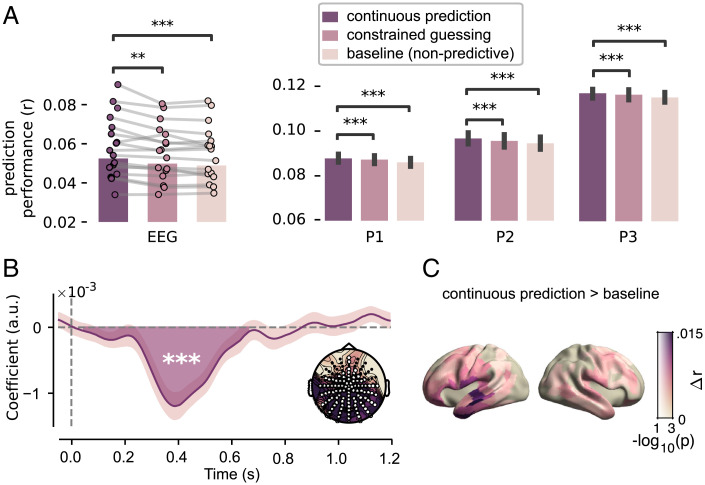
Fig. 2.
Neural responses are modulated by probabilistic predictions. (A) Model comparison. Cross-validated correlation coefficients for EEG (Left) and each MEG participant (Right). EEG: dots with connecting lines represent individual participants (averaged over all channels). MEG: bars represent median across runs, error bars represent bootstrapped absolute deviance (averaged over language network sources). (B) EEG: coefficients describing the significant effect of lexical surprise (see SI Appendix, Fig. S3 for the full topography over time). Highlighted area indicates extent of the cluster, and shaded error bar indicates bootstrapped SE. Inset shows distribution of absolute t values and of channels in the cluster. (C) Difference in prediction performance across cortex (transparency indicates family-wise-error (FWE)-corrected P values). Significance levels correspond to P < 0.01 (**), P < 0.001 (***) in a two-tailed paired Student’s t or Wilcoxon sign rank test.

