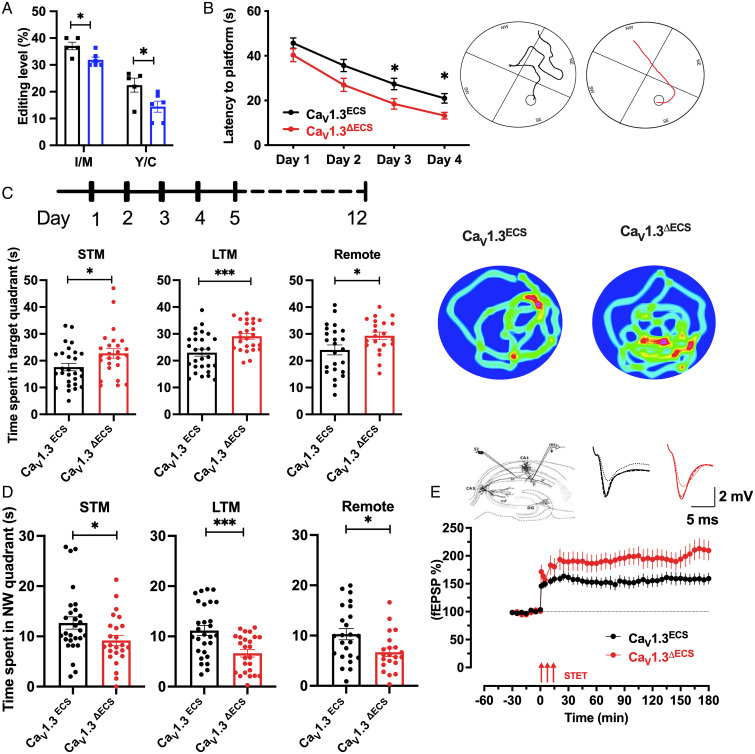
Fig. 2.
Enhanced spatial learning and memory of CaV1.3ΔECS mice in Morris water maze. (A) Quantification of IQ-domain RNA editing levels at I-to-M and Y-to-C sites of CaV1.3 channels in hippocampal CA1 region from CaV1.3ECS mice with (n = 6) and without (n = 5) water maze training. (B) Learning curve of CaV1.3ECS (n = 28) and CaV1.3ΔECS mice (n = 25) during the Morris water maze training. Average latency to platform of training trials is presented. Inset: Representative swimming traces of CaV1.3ECS and CaV1.3ΔECS mice exhibited the training trails on Day 4. (C) Time spent in target quadrant during probe tests. Left: STM probe test; Middle: LTM probe; Right: Remote probe test. Inset: Representative heat map of CaV1.3ECS and CaV1.3ΔECS mice exhibits the time spent in each quadrant in LTM probe test. (D) Time spent in northwestern quadrant (opposite of the targeted southeastern quadrant) during STM (Left), LTM (Middle), and remote (Right) probe tests. (E) Late LTP in CaV1.3ECS and CaV1.3 ΔECS mice with STET delivered in the stratum radiatum to stimulate Schaffer collateral fibers (Left Inset). STET in CaV1.3 ΔECS mice also resulted in a long-lasting LTP with CaV1.3 ΔECS mice showing a significantly higher percentage of potentiation than CaV1.3ECS mice from 90 min onward until 180 min (Scale bar, 5 ms, 2 mV). Data represent means ± SEM. Scatters in bars indicate the number of analyzed animals. Two-way ANOVA with Sidak’s multiple comparisons test was used for data in (B). Difference between genotypes, F (1, 50) = 10.77, P = 0.0019), *P < 0.05. The two-tailed unpaired Student’s t test was used for data in (A, C, D); *P < 0.05, ***P < 0.001. The Mann–Whitney U test was used for data in (E) (90 min, P = 0.02; 120 min, P = 0.02; 180 min, P = 0.02).

