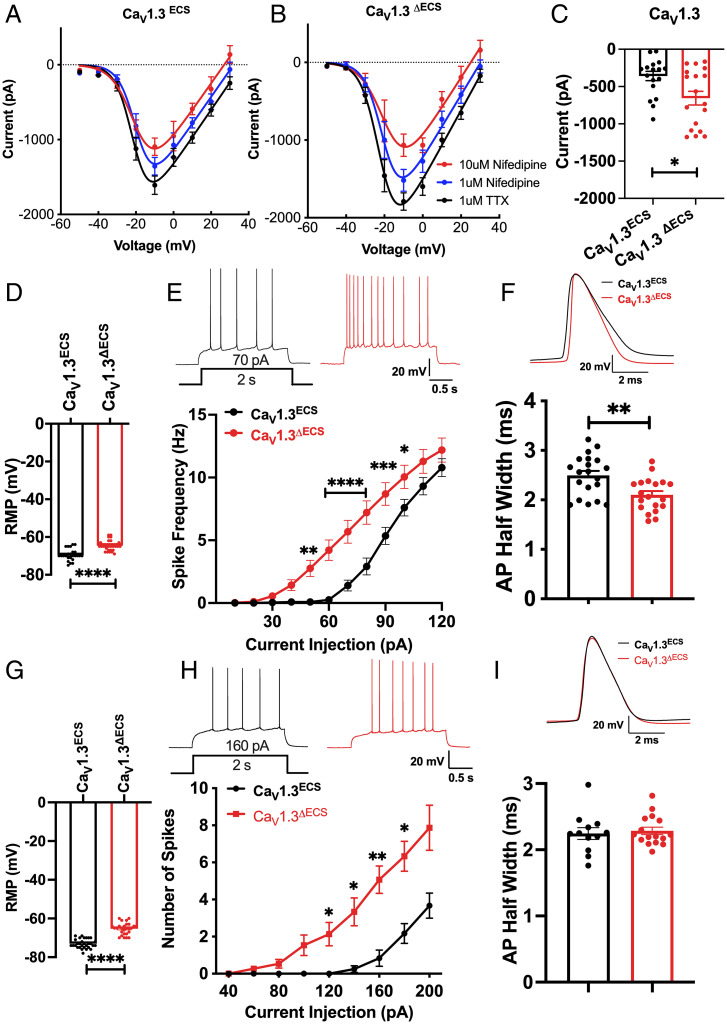
Fig. 3.
Deletion of IQ-domain RNA editing increases CaV1.3 channel current and leads to enhanced neuronal excitability. (A and B) I-V curve of calcium current recorded from CA1 pyramidal neurons in hippocampal slices from CaV1.3ECS and CaV1.3ΔECS mice. The total Ca2+ currents were first recorded with 1uM TTX, and 1uM nifedipine was then applied to the bath solution to mostly block the high-affinity CaV1.2 channels. To isolate the low-affinity CaV1.3 currents, 10 μM nifedipine was subsequently added. (C) Increased amount of CaV1.3 currents calculated by the difference in peak Ca2+ currents recorded in 1uM versus 10 μM nifedipine at −10 mV. (D) Depolarized RMP of CA1 pyramidal neurons in CaV1.3ΔECS mice. (E) Representative traces of spike frequency (with 70 pA current injection for 2 s) and frequency–current curve showing spike frequency with current injection in CA1 pyramidal neurons. n = 24 and n = 19 for CaV1.3ECS and CaV1.3ΔECS mice, respectively. (F) Representative traces and quantification of CA1 pyramidal neurons AP half-width measured from average of the first AP in 5 trains with 10 s interval induced with 200 pA current injection. (G) Depolarized RMP of CA3 pyramidal neurons in CaV1.3ΔECS mice. (H) Representative traces of spike frequency (with 160 pA current injection for 2 s) and frequency–current curve showing spike frequency with current injection in CA3 pyramidal neurons of CaV1.3ECS (n = 12) and CaV1.3ΔECS mice (n = 15). (I) Representative traces and quantification of CA3 pyramidal neurons AP half-width measured from the average of the first AP in 5 trains with 10 s interval induced with 250 pA current injection did not show any difference between CaV1.3ECS and CaV1.3ΔECS mice. Data represent means ± SEM. Scatters in bars indicate the number of analyzed neurons. Two-way ANOVA with Bonferroni’s multiple comparisons test was used for data in (E and H); the two-tailed unpaired Student’s t test was used for analysis of data in all other panels. *P < 0.05; **P < 0.01; ***P < 0.001; ****P < 0.0001.

