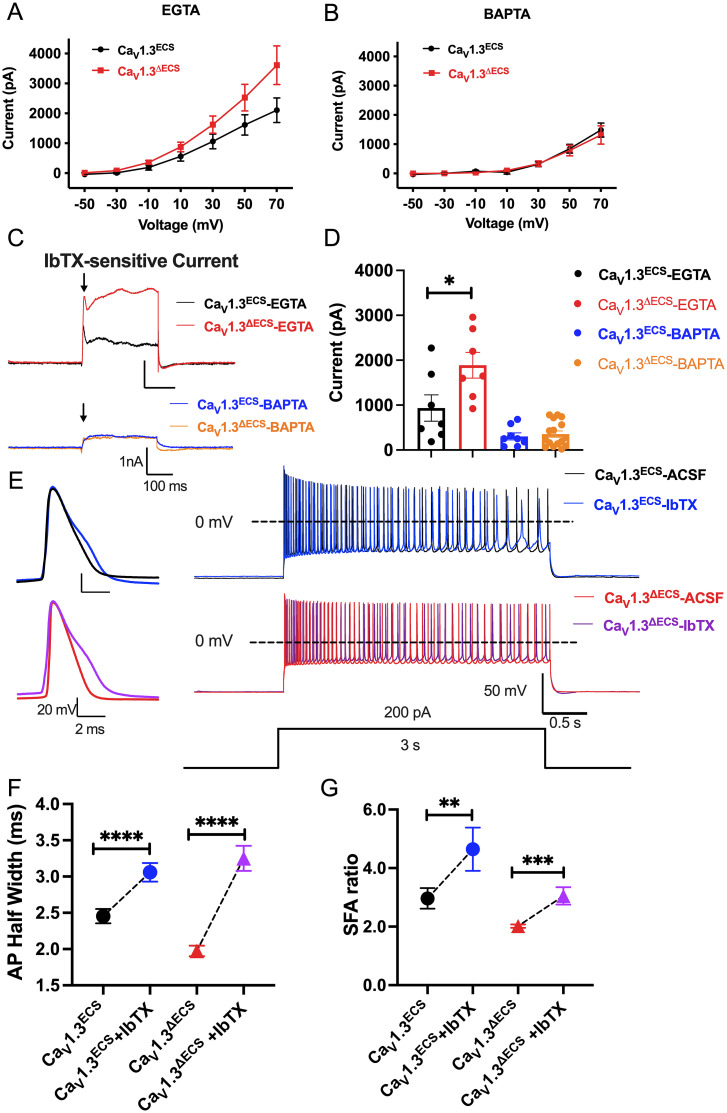
Fig. 4.
Increased BK current in CaV1.3ΔECS mice due to close coupling with CaV1.3 channel affects APD and SFA in CA1 neurons. (A) I-V curve of IK currents recorded with EGTA in the pipette solution from CA1 pyramidal neurons in hippocampal slices from CaV1.3ECS (n = 7) and CaV1.3ΔECS (n = 8) mice. (B) I-V curve of IK currents recorded with BAPTA in the pipette solution from CA1 pyramidal neurons in hippocampal slices from CaV1.3ECS (n = 13) and CaV1.3ΔECS (n = 22) mice. (C) Representative trace quantification of subtracted IbTX-sensitive IBK in CA1 pyramidal neurons with the presence of EGTA or BAPTA in the internal solution. (D) Quantification of IbTX-sensitive IBK in CA1 pyramidal neurons with the presence of EGTA or BAPTA in the internal solution. (E) Representative traces of the first AP and trains of APs induced by 200 pA current injection for 3 s before and after IbTX treatment in CA1 pyramidal neurons. (F) Quantification of AP half-width before and after 100 nM IbTX treatment from CaV1.3ECS (n = 20) and CaV1.3ΔECS mice (n = 14). (G) Quantification of SFA ratio before and after IbTX treatment in CaV1.3ECS (n =15) and CaV1.3ΔECS mice (n = 21). Data represent means ± SEM. Scatters in bars indicate the number of analyzed neurons. The two-tailed unpaired Student’s t test was used for analysis of data in (D); the two-tailed paired Student’s t test was used for analysis of data in (F and G). *P < 0.05; **P < 0.01; ***P < 0.001; ****P < 0.0001.

