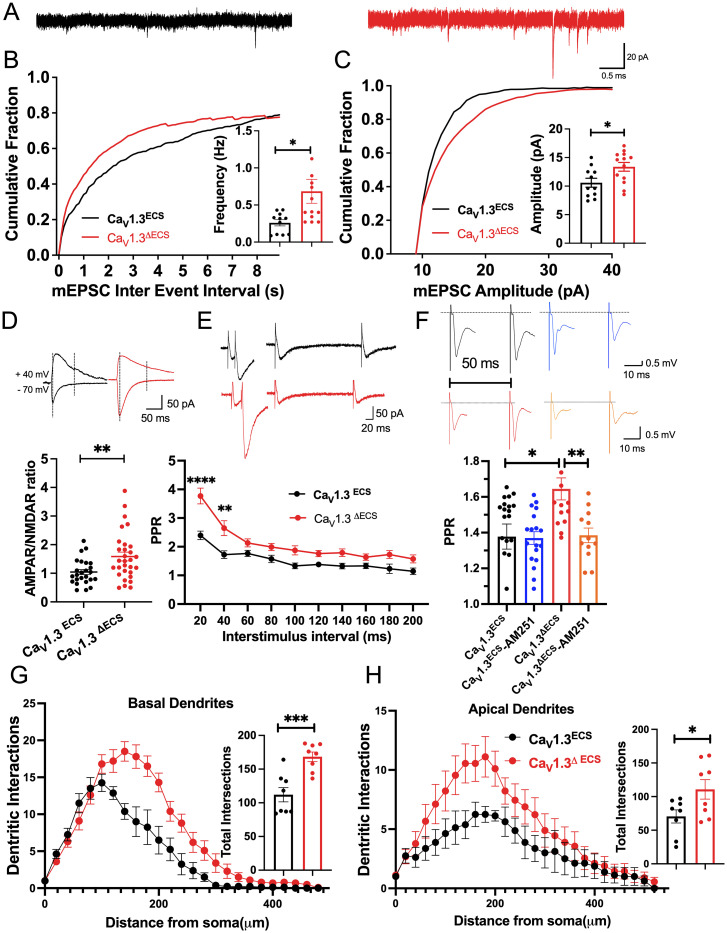
Fig. 5.
Increased synaptic transmission and dendritic intersections of CA1 pyramidal neurons in CaV1.3ΔECS mice. (A) Representative trace of mEPSCs recorded in CA1 pyramidal neurons from CaV1.3ECS (black) and CaV1.3ΔECS mice (red) (Scale bar, 0.5 s and 20 pA). (B and C) Histogram and cumulative fraction of the interevent interval and amplitude of mEPSCs, n = 11 and n = 13 for CaV1.3ECS and CaV1.3ΔECS mice. (D) Representative traces and quantification of AMPAR/NMDAR ratio calculated by estimating the respective AMPAR and NMDAR component at +40 mV based on their different time courses (Scale bar, 50 ms and 50 pA). (E) Representative traces and quantification of PPR recorded in CA1 pyramidal neurons with stimulus located in the stratum radiatum at various interpulse intervals from 20 to 200 ms. n = 30 and n = 24 for CaV1.3ECS and CaV1.3ΔECS mice, respectively (Scale bar, 20 ms and 50 pA). (F) Quantification of PPR measured from the slope of fEPSPs with stimulus located in the stratum radiatum at a 50 ms interpulse interval before and after applying CB1R antagonist AM251 (10 µM). n = 20 and n = 15 for CaV1.3ECS and CaV1.3ΔECS mice, respectively, before AM251 treatment. n = 18 and n = 12 for CaV1.3ECS and CaV1.3ΔECS mice, respectively, after applying AM251. (G and H) Quantification of basal and apical dendritic intersections of CA1 pyramidal neurons. Total intersections were counted. n = 8 and n = 8 for CaV1.3ECS and CaV1.3ΔECS mice, respectively. Data represent means ± SEM. Scatters in bars indicate the number of analyzed neurons or slices. Two-way ANOVA with Bonferroni’s multiple comparisons test was used for data in (E); the two-tailed unpaired Student’s t test was used for analysis of data in all other panels. *P < 0.05; **P < 0.01; ***P < 0.001.

