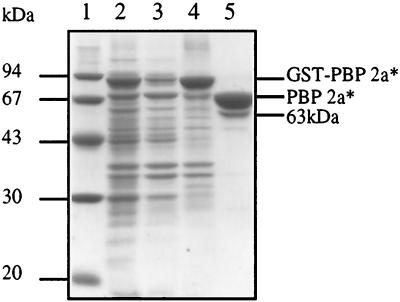
FIG. 3.
Analysis of solubilization and purification of PBP 2a*. Proteins were separated by SDS–12.5% PAGE and stained with Coomassie blue. The numbers to the left indicate the sizes of standard molecular mass markers. Lanes: 1, molecular mass markers; 2, total cell proteins; 3, soluble supernatant; 4, 0.5% CHAPS soluble extract; 5, PBP 2a* eluted from glutathione Sepharose after thrombin cleavage.

