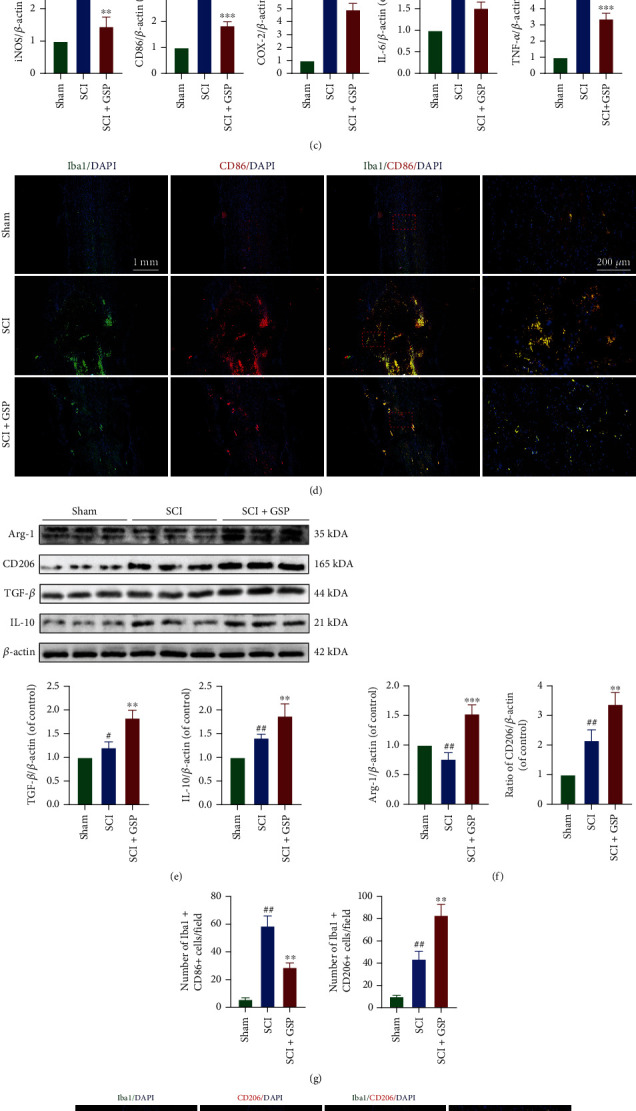
Figure 4.

Effect of GSP on microglial polarisation in vivo. (a) The M1/M2-related mRNA expressions were measured by qRT-PCR (n = 3/group). (b, c, e, f) Representative WB and quantitative data of M1/M2-related protein levels in each group. (n = 3/group). (d, g, h) Representative IF and quantitative data of CD86/CD206 at 14 dpi and (n = 3/group). #p < 0.05, ##p < 0.01 vs. sham group. ∗p < 0.05, ∗∗p < 0.01, or ∗∗∗p < 0.001 vs. SCI group.
