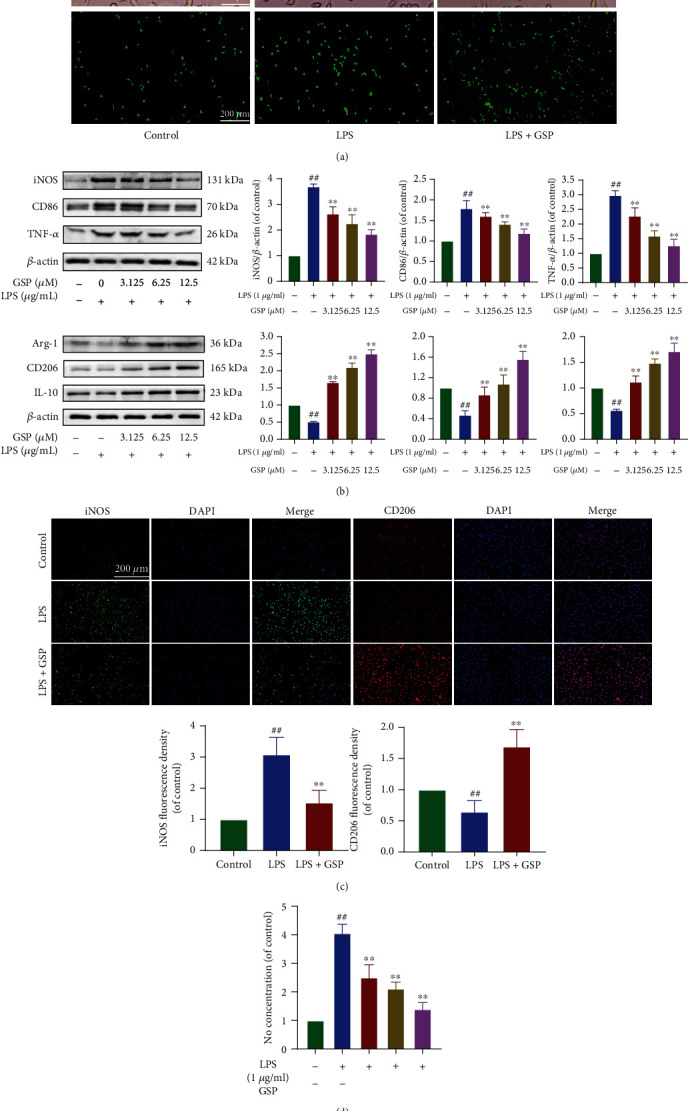
Figure 7.

Effect of GSP on microglial polarisation in vitro. (a) Morphological results and IF for Iba1 in each group. Scale bar = 200 μm. (b) Representative WB and quantitative data of M1/M2-related proteins. (c) IF and quantitative data of iNOS and CD206 in each group. (d) NO concentration of each group. ##p < 0.01 vs. control group. ∗∗p < 0.01 vs. LPS-treated group.
