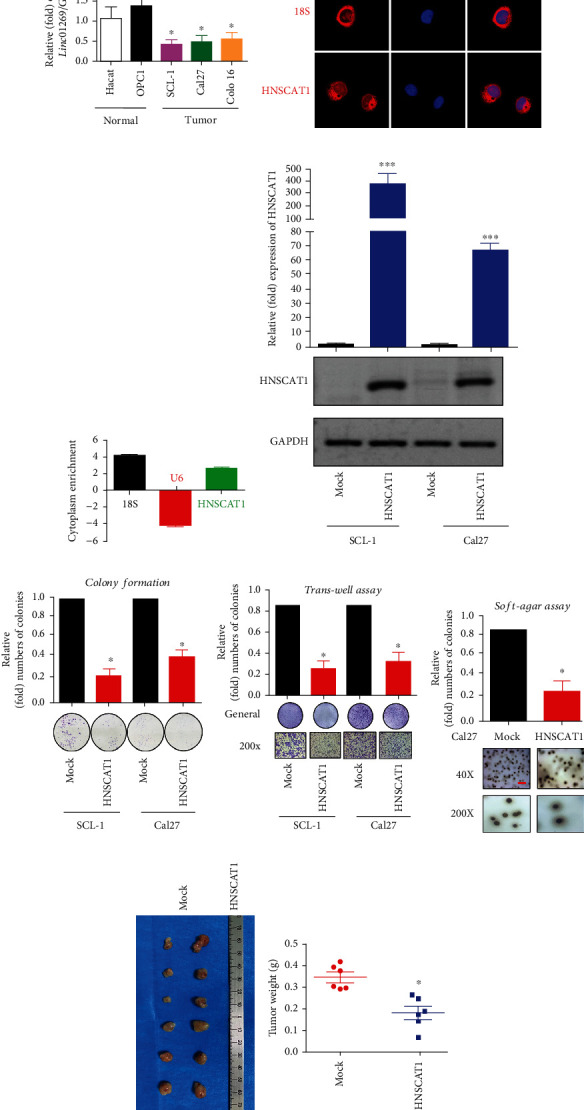
Figure 2.

HNSCAT1 serves as a negative regulator of HNSC. (a) Real-time PCR revealed that lincRNA HNSCAT1 was downregulated in HNSC cell lines. HaCaT cells and primary keratinocytes (PK) served as normal controls. The value of HaCaT was set to 1. Data are presented as the means ± SD of three biological replicates. Significance was assessed by unpaired two-tailed Student's t-test. ∗p < 0.05. (b) RNA-FISH indicated that HNSCAT1 RNA was mainly distributed in the cytoplasm. (c) A nuclear-cytoplasmic RNA extraction assay was performed. Real-time PCR was performed to identify RNA distribution. U6 served as the nuclear control, while 18S was the cytoplasmic control. (d) Real-time PCR was performed to examine the overexpression efficacy of HNSCAT1 in SCL-1 and Cal27 cells. Data are presented as the means ± SD of three biological replicates. Significance was assessed by unpaired two-tailed Student's t-test. ∗∗∗p < 0.001. (e) Colony formation assays were conducted to determine proliferative capacity after overexpression of lincRNA HNSCAT1 in SCL-1 and Cal27 cells. Data are presented as the means ± SD of three biological replicates. Significance was assessed by unpaired two-tailed Student's t-test. ∗p < 0.05. (f) Transwell assays showed that migration was impaired after the restoration of lincRNA HNSCAT1 in SCL-1 and Cal27 cells. Data are presented as the means ± SD of three biological replicates. Significance was assessed by unpaired two-tailed Student's t-test. ∗p < 0.05. (g) A soft-agar colony formation assay was conducted to determine colony formation capacity after overexpression of lincRNA HNSCAT1 in Cal27 cells. Data are presented as the means ± SD of three biological replicates. Significance was assessed by unpaired two-tailed Student's t-test. ∗p < 0.05. (h) Subcutaneous xenografts were established in HNSCAT1-overexpressing and control cells. N = 6 for each group. (i) Tumor weight in each xenograft. ∗p < 0.05. Experiments were conducted in triplicate, and the results are shown as the mean ± SEM. ∗p < 0.05.
