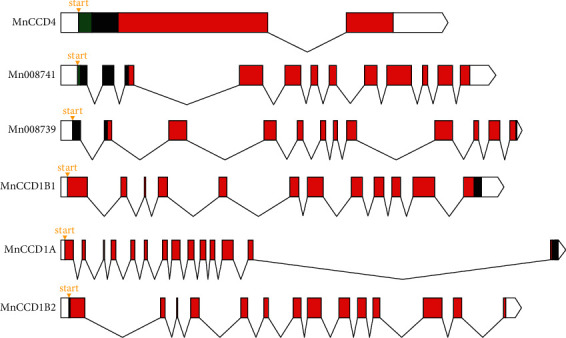
Figure 4.

Abridged general view of the MnCCD gene structure. Orange triangle: transcription start site; white rectangles: 5′UTR; green rectangles: chloroplast transit peptide; red rectangles: RPE65 domain; black broken lines: introns; white polygons: 3′UTR.
