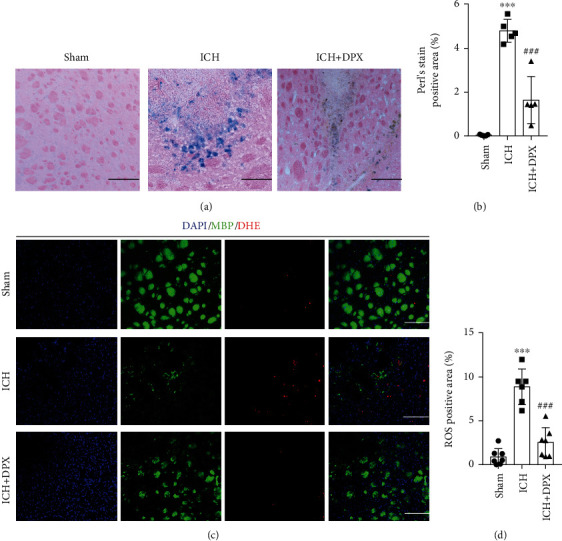
Figure 5.

The administration of DPX reduced iron and ROS accumulation after ICH in mice. (a) Representative Perl's blue staining indicating iron accumulation in each group. Scale bars: 50 μm. (b) Semiquantification of iron accumulation from (a). n = 5 in each group; F(2, 12) = 61.52; ∗∗∗p < 0.001 vs. Sham group; ###p <0.001 vs. ICH group; one-way ANOVA, followed by Turkey's post hoc test. (c) Double staining of MBP (green) and DHE (red) demonstrating the ROS level in each group. Scale bars: 50 μm. (d) The percentage of ROS positive area from (e). n = 7 in Sham group, n = 6 in ICH group, n = 7 in ICH + DPX group; F (2, 17) = 44.08; ∗∗∗p < 0.001 vs. Sham group; ###p < 0.001 vs. ICH group; one-way ANOVA, followed by Turkey's post hoc test.
