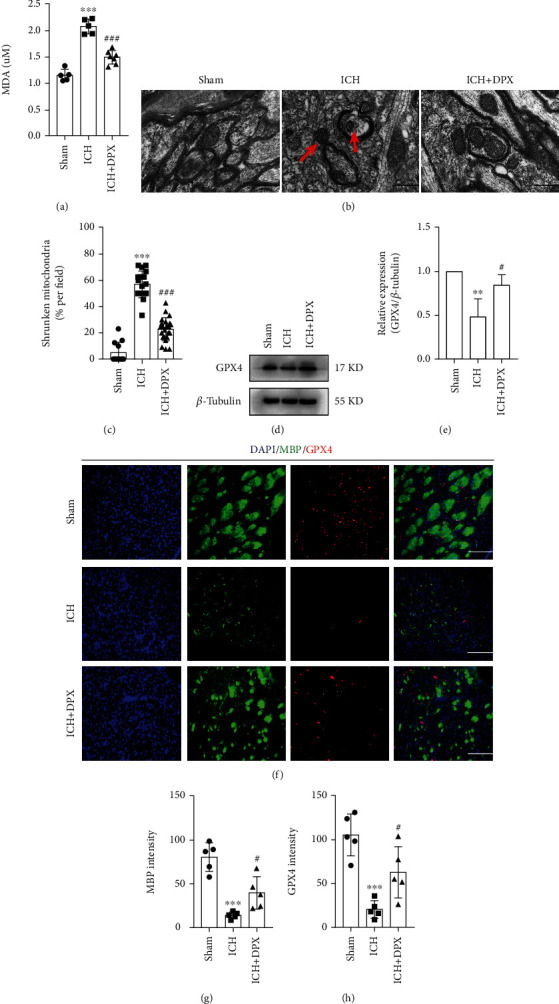
Figure 6.

The administration of DPX inhibited glutathione-dependent ferroptosis in oligodendrocytes after ICH in mice. (a) MDA tests indicating the level of lipid peroxidation. n = 5 in Sham group, n = 5 in ICH group, n = 7 in ICH + DPX group; F (2, 14) = 67.79; ∗∗∗p < 0.001 vs. Sham group; ###p < 0.001 vs. ICH group; one-way ANOVA, followed by Turkey's post hoc test. (b) The typical TEM imaging showing the morphology of mitochondria in each group. Red arrow indicating shrunken mitochondria. Scale bars: 2 μm. (c) The percentage of shrunken mitochondria in each group from (b). n = 12 in Sham group, n = 18 in ICH group, n = 23 in ICH + DPX group; Kruskal − Wallis statistic = 42.13; ∗∗∗p < 0.001 vs. Sham group; ###p < 0.001 vs. ICH group; one-way ANOVA, followed by Turkey's post hoc test. (d) Immunoblot bands representing the expression of GPX4 in each group. β-Tubulin was served as an internal control. (e) Semiquantification of GPX4 from (d). n = 3 in each group; F (2, 6) = 11.08; ∗∗p < 0.01 vs. Sham group; #p < 0.05 vs. ICH group; one-way ANOVA, followed by Turkey's post hoc test. (f) Double immunostaining of MBP (green) and GPX4 (red). Scale bars: 50 μm. (g), (h) Semiquantification of the optic intensity of MBP (g) and GPX4 (h). n = 5 in each group; F (2, 12) = 26.75 for MBP; F (2, 12) = 17.71 for GPX4; ∗∗∗p < 0.001 vs. Sham group; #p < 0.05 vs. ICH group; one-way ANOVA, followed by Turkey's post hoc test.
