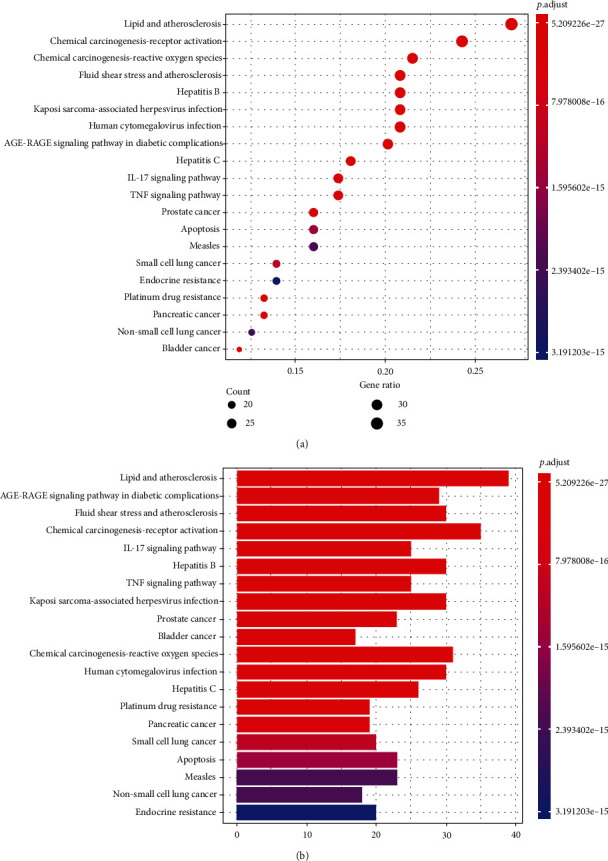
Figure 6.

(a) Dot plot of KEGG enrichment analysis. The size of the bubble represents the number of targets enriched in the indicated pathway, and the color of the bubble represents the p value of enrichment. (b) Bar plot of KEGG enrichment analysis.
