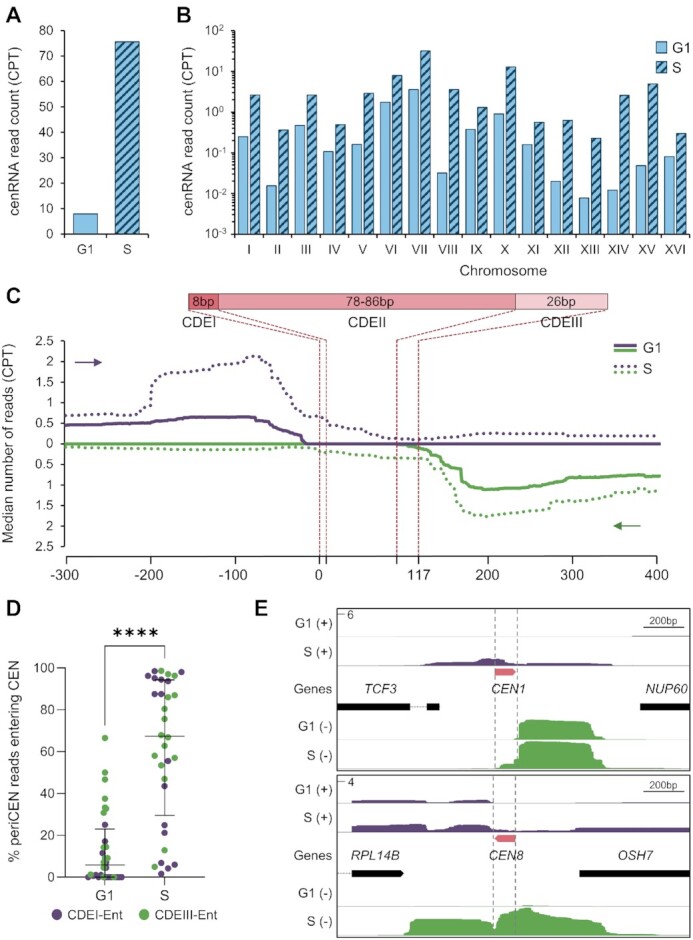
Figure 2.

Iso-Seq reveals a complex transcriptional landscape at centromeres. (A) Number of normalized cenRNA reads (transcripts entering CEN by at least 1 nt) measured by counts per thousand (CPT) after hybridization capture enrichment. Input reads are not shown because they were not detected. (B) Distribution of normalized cenRNA read counts per thousand (CPT) per chromosome. (C) Aggregate plot of median read count around centromeres. All 16 centromeres, regardless of the strand of origin, were aligned at the beginning of the CDEI element (top plot) or the beginning of the CDEIII element (bottom plot). The 5′–3′ direction is indicated by a purple arrow for reads converging toward the CDEI element and a green arrow for reads converging towards the CDEIII element. The structure of the centromere is schematically shown on the top. (D) Distribution of the proportion of periCEN reads that enter the CEN in G1 versus S phase. Each centromere is represented by two dots for reads coming from each strand. Median plus interquartile range is displayed in black. P-values determined by a paired Wilcoxon test (****P < 0.0001). (E) Example of Iso-Seq profiles at CEN1 and CEN8. Position of centromere boundaries is shown by the vertical grey dotted lines. Reads coming from the (+) strand are shown in purple while reads coming from the (–) strand are shown in green. The y-axis represents the maximum CPT.
